| Description | Value or Code |
|---|---|
| Cruise_Name:, Vaux(12,:) | NIST |
| Cruise_Number | 2017-001 |
| Investigator:: Vaux(16,:) | Carol Johnson |
| Location_of_Measurement: Vaux(17,:) | NIST B019_221 |
| Purpose: Vaux(18,:) | Stability Measurement |
| MOBY_NET_Sequence_Position: Vaux(20,:) | Calibration Facility |
| Ambient_Air_Temp (deg C) | 22.9 |
| Relative_Humidity (%) | 24 |
| #_of_Levels | 4 |
| Time_Step (sec) | 10 |
| Initial lamp state: Vaux(40,:) | All Off |
| Time_adjustment_to_GMT | 0 |
| Time_of_Last_Servicing | 20151218 |
| SQM_120VAC_On | 20170322.193500 |
| SQM_Off_to_Standby | 20170407.193837 |
| SQM_Standby_to_Off | 20170407.205919 |
| SQM_120VAC_Off | 20170322.210300 |
| Lamp 1 A burn hours | 0.9375 |
| Lamp 3 A burn hours | 0.70361 |
| DAQ_Program_Version | 0 |
| File Format Version | 2 |
| DAQ_Computer: Vaux(60,:) | EOS EQUIP 13 |
| DAQ_Program_Name: Vaux(61,:) | SQM Monitor_2.0.vi |
|
All Devices Under Test in the DUT column in DATA: DUT_White_Fiducial DUT_Net_CAS_Lu |
|
ASCII SQM file data: SQM_20170407_001.txt
ASCII SQM file data: PDF log file
| Lamp | On/Off # | N | Time on (hrs) | Mean (meas./set) | std | %std |
|---|---|---|---|---|---|---|
| Lamp 1A | 1 | 307 | 0.89333 | 0.94998 / 0.95 | 0.00011136 | 0.011722 |
| Lamp 3A | 1 | 202 | 0.58694 | 3 / 3 | 0.0013343 | 0.044477 |
| Level | PD internal monitor (V) | Level Change # | Mean | std | %std |
|---|---|---|---|---|---|
| Low (1A) | Red | 1 | 0.2616 | 0.085942 | 32.8531 |
| Low (1A) | White | 1 | 0.25491 | 0.082416 | 33.7146 |
| Low (1A) | Blue | 1 | 0.2157 | 0.045751 | 39.8429 |
| High (1A & 3A) | Red | 2 | 1.3224 | 0.42314 | 31.9984 |
| High (1A & 3A) | White | 2 | 1.4214 | 0.4662 | 29.7685 |
| High (1A & 3A) | Blue | 2 | 1.3496 | 0.45224 | 31.3528 |
| Medium (3A) | Red | 3 | 1.3069 | 0.0018242 | 0.13959 |
| Medium (3A) | White | 3 | 1.4374 | 0.0029846 | 0.12691 |
| Medium (3A) | Blue | 3 | 1.397 | 0.0023993 | 0.13058 |
| Level | Temperature (C) | Level Change # | Mean | std | %std |
|---|---|---|---|---|---|
| Low (1A) | PD | 1 | 34.99 | 0.10413 | 0.29761 |
| High (1A & 3A) | PD | 2 | 35.0089 | 0.12322 | 0.35198 |
| Medium (3A) | PD | 3 | 34.9463 | 0.11013 | 0.31513 |
Red PD (max value): 1.5075: #of possible satureated values 0
White PD (max value): 1.6309: #of possible satureated values 0
Blue PD (max value): 1.5496: #of possible satureated values 0
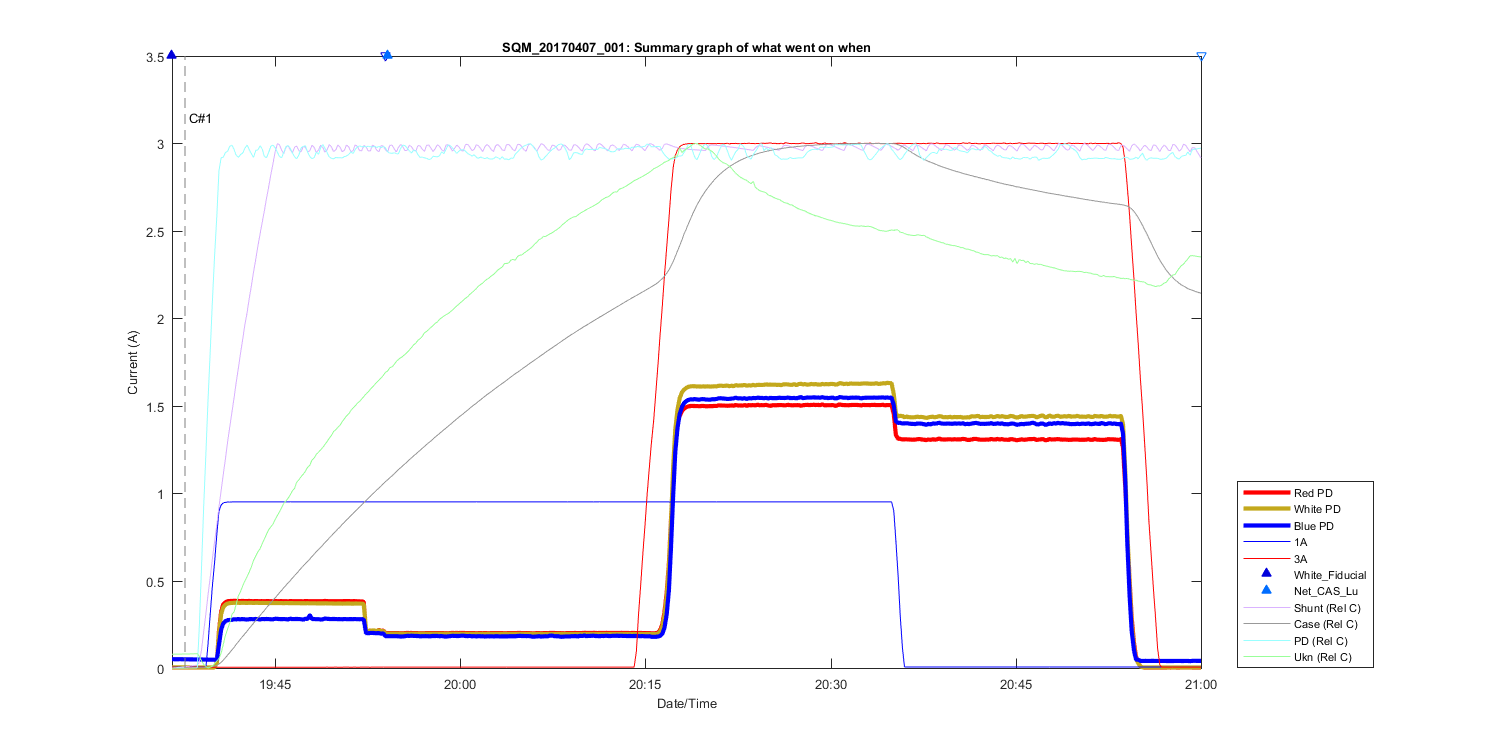
Figure 1
Summary Graph showing all measurements taken in this file, including auxilliary temperature measurements and comments. The text C# shows what time in the file the comments (shown above where made). The triangles at the top of the figure shows then a DUT (Device under test) was placed in front of the SQM and removed.
Figure 2
Figure 3
Figure 4
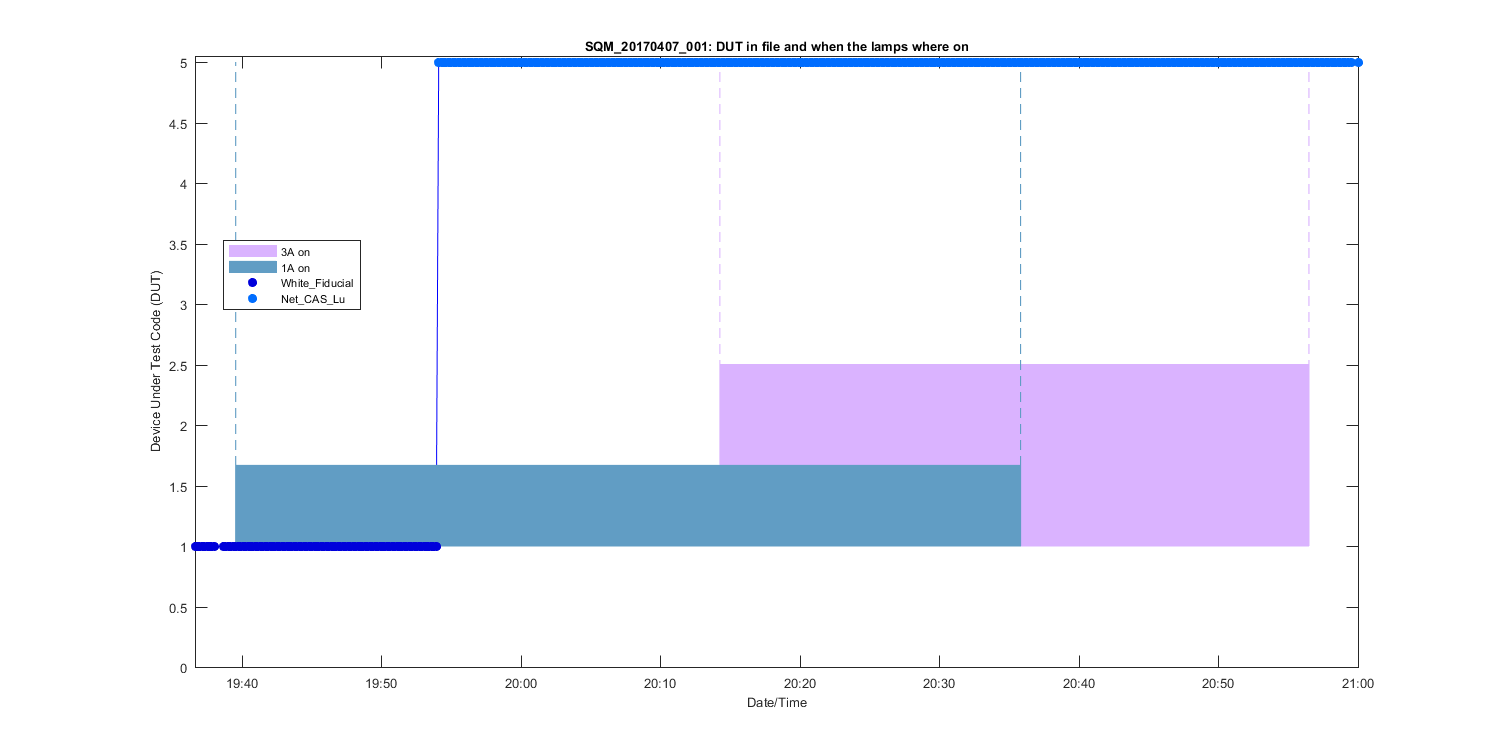
Figure 5
Figure 6
Figure 7
Figure 8
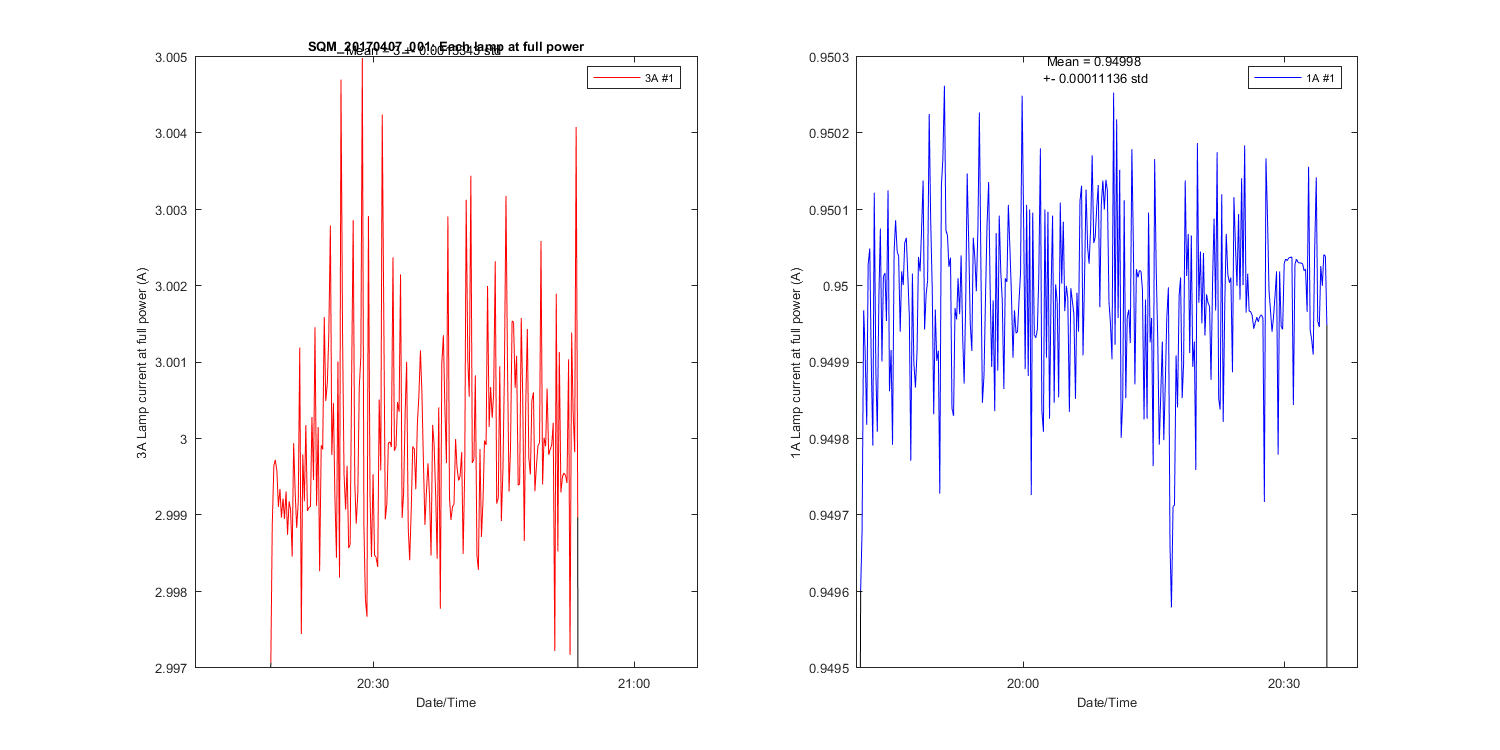
Figure 9
Figure 10