| Description | Value or Code |
|---|---|
| Cruise_Name:, Vaux(12,:) | NIST |
| Cruise_Number | 2017-001 |
| Investigator:: Vaux(16,:) | Carol Johnson |
| Location_of_Measurement: Vaux(17,:) | NIST B019_221 |
| Purpose: Vaux(18,:) | Stability Measurement |
| MOBY_NET_Sequence_Position: Vaux(20,:) | Calibration Facility |
| Ambient_Air_Temp (deg C) | 23 |
| Relative_Humidity (%) | 50 |
| #_of_Levels | 4 |
| Time_Step (sec) | 10 |
| Initial lamp state: Vaux(40,:) | All Off |
| Time_adjustment_to_GMT | 0 |
| Time_of_Last_Servicing | 20151218 |
| SQM_120VAC_On | 20170501.185730 |
| SQM_Off_to_Standby | 20170501.190035 |
| SQM_Standby_to_Off | 20170501.203339 |
| SQM_120VAC_Off | 20170501.203500 |
| Lamp 1 A burn hours | 1.2936 |
| Lamp 3 A burn hours | 0.54583 |
| DAQ_Program_Version | 0 |
| File Format Version | 2 |
| DAQ_Computer: Vaux(60,:) | EOS EQUIP 13 |
| DAQ_Program_Name: Vaux(61,:) | SQM Monitor_2.0.vi |
|
All Devices Under Test in the DUT column in DATA: DUT_White_Fiducial DUT_Net_CAS_Lu |
|
ASCII SQM file data: SQM_20170501_001.txt
ASCII SQM file data: PDF log file
| Lamp | On/Off # | N | Time on (hrs) | Mean (meas./set) | std | %std |
|---|---|---|---|---|---|---|
| Lamp 1A | 1 | 427 | 1.2439 | 0.94999 / 0.95 | 0.00011603 | 0.012213 |
| Lamp 3A | 1 | 147 | 0.42639 | 3.0001 / 3 | 0.00032429 | 0.010809 |
| Level | PD internal monitor (V) | Level Change # | Mean | std | %std |
|---|---|---|---|---|---|
| Low (1A) | Red | 1 | 0.32036 | 0.086393 | 26.9675 |
| Low (1A) | White | 1 | 0.30746 | 0.081446 | 28.0991 |
| Low (1A) | Blue | 1 | 0.24627 | 0.046188 | 35.0799 |
| High (1A & 3A) | Red | 2 | 1.3172 | 0.42958 | 32.6127 |
| High (1A & 3A) | White | 2 | 1.4165 | 0.47395 | 30.3262 |
| High (1A & 3A) | Blue | 2 | 1.3441 | 0.45884 | 31.9593 |
| Medium (3A) | Red | 3 | 1.3078 | 0.0009664 | 0.073896 |
| Medium (3A) | White | 3 | 1.4377 | 0.00066874 | 0.067217 |
| Medium (3A) | Blue | 3 | 1.397 | 0.001423 | 0.069177 |
| Level | Temperature (C) | Level Change # | Mean | std | %std |
|---|---|---|---|---|---|
| Low (1A) | PD | 1 | 35.0052 | 0.10965 | 0.31323 |
| High (1A & 3A) | PD | 2 | 35.0356 | 0.10827 | 0.30902 |
| Medium (3A) | PD | 3 | 35.0353 | 0.096269 | 0.27478 |
Red PD (max value): 1.5065: #of possible satureated values 0
White PD (max value): 1.6295: #of possible satureated values 0
Blue PD (max value): 1.5483: #of possible satureated values 0
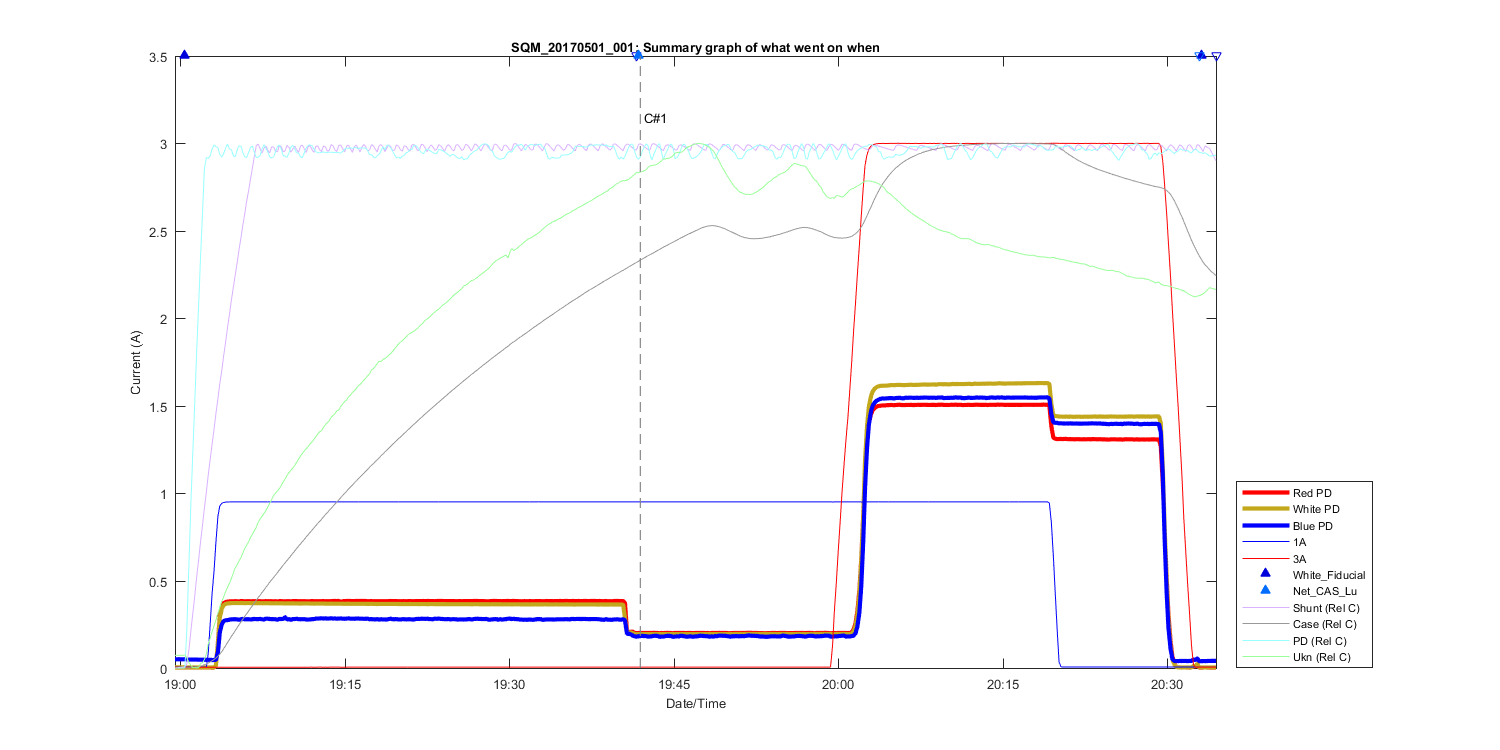
Figure 1
Summary Graph showing all measurements taken in this file, including auxilliary temperature measurements and comments. The text C# shows what time in the file the comments (shown above where made). The triangles at the top of the figure shows then a DUT (Device under test) was placed in front of the SQM and removed.
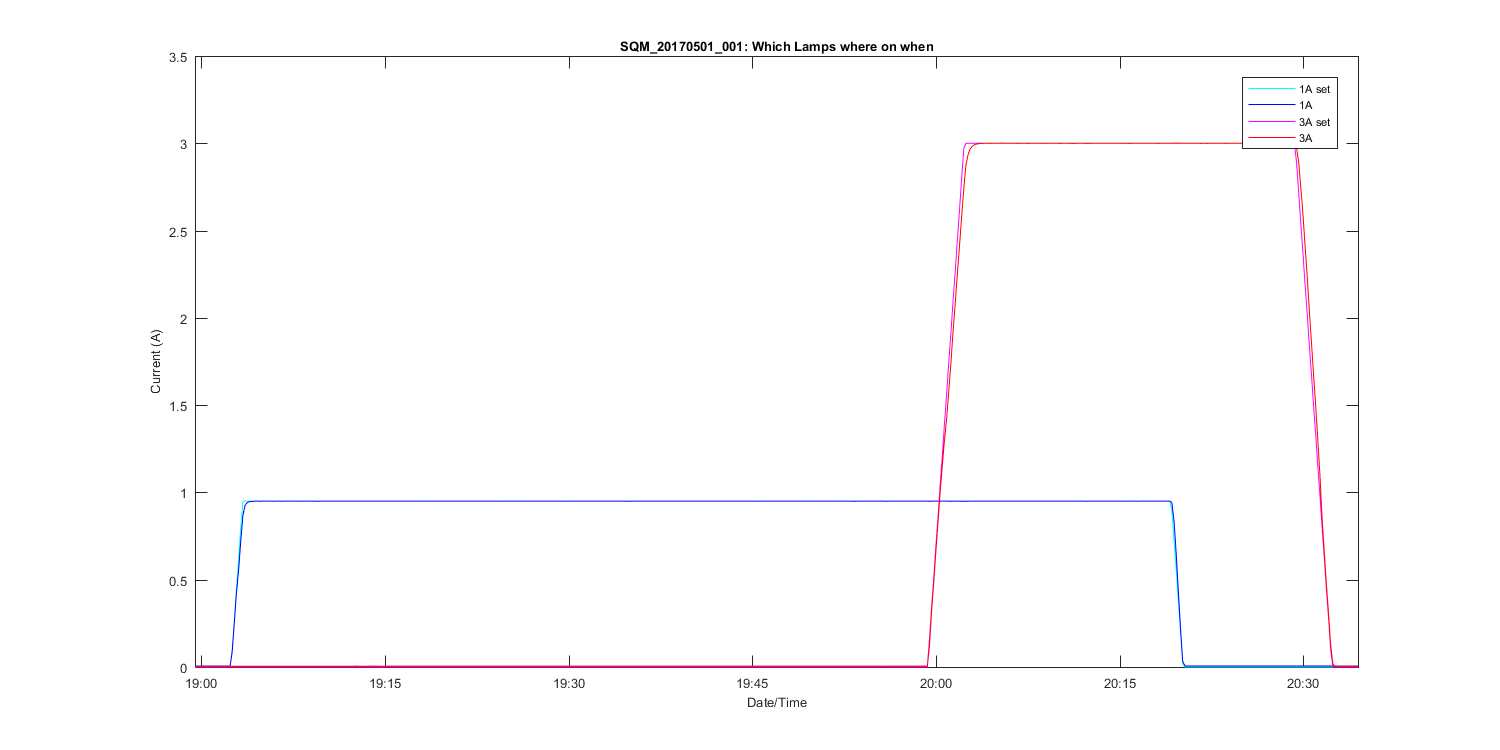
Figure 2
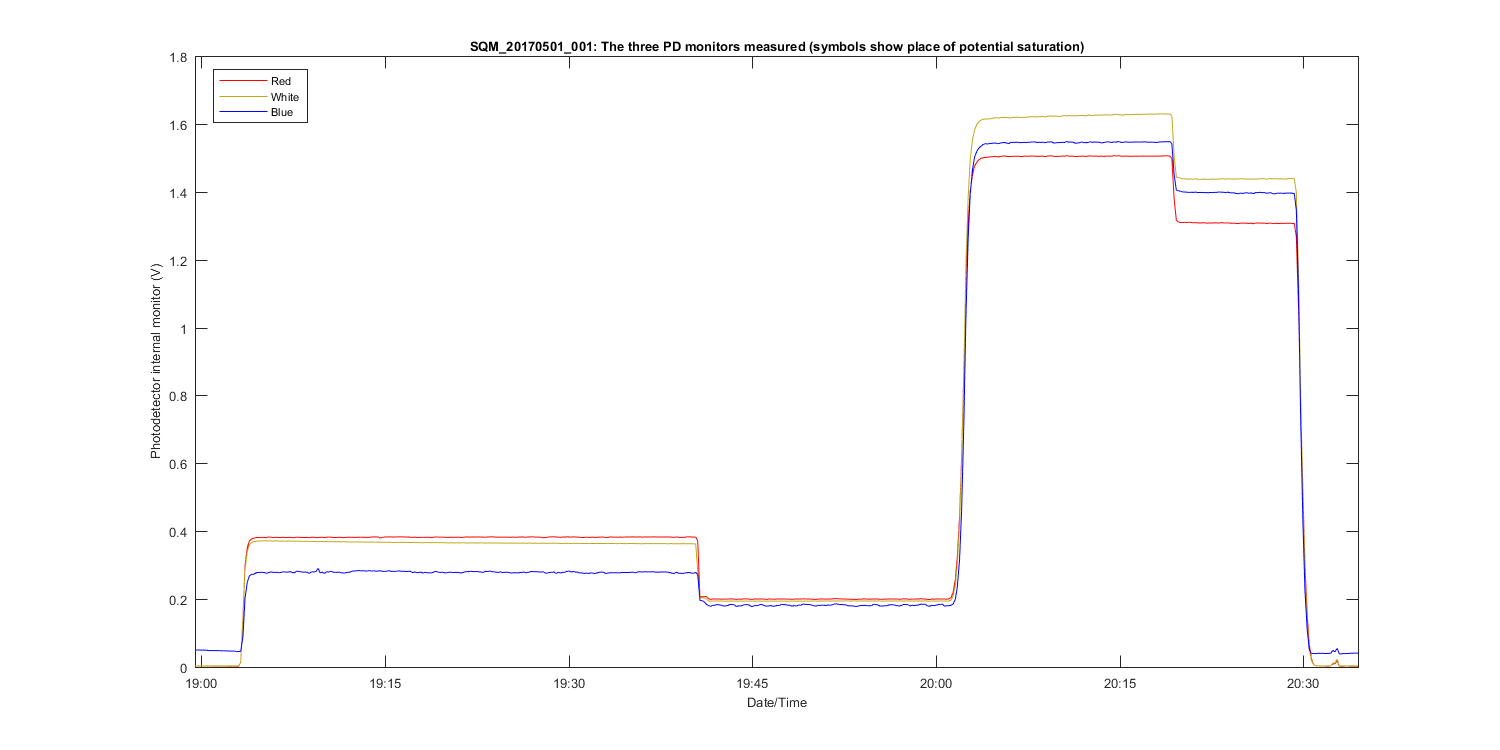
Figure 3
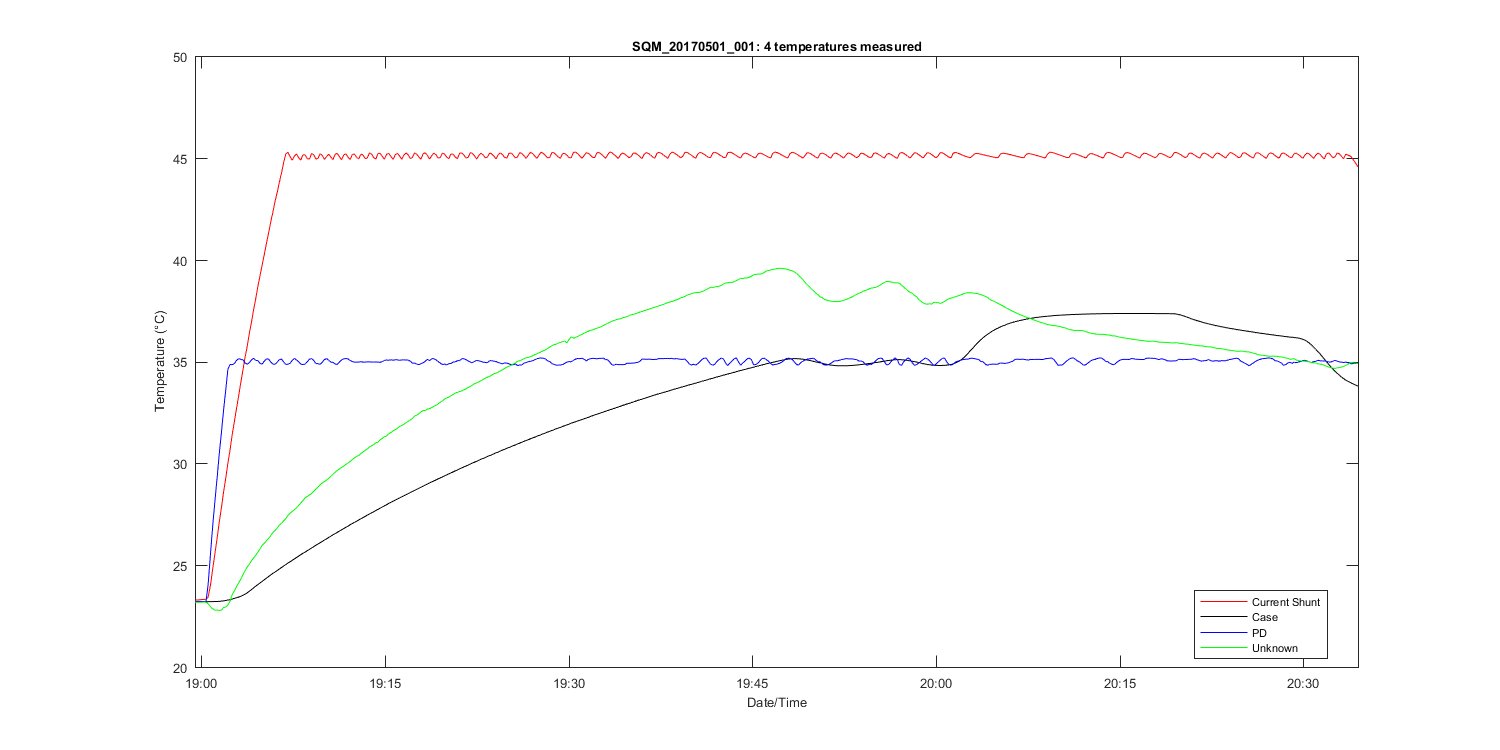
Figure 4
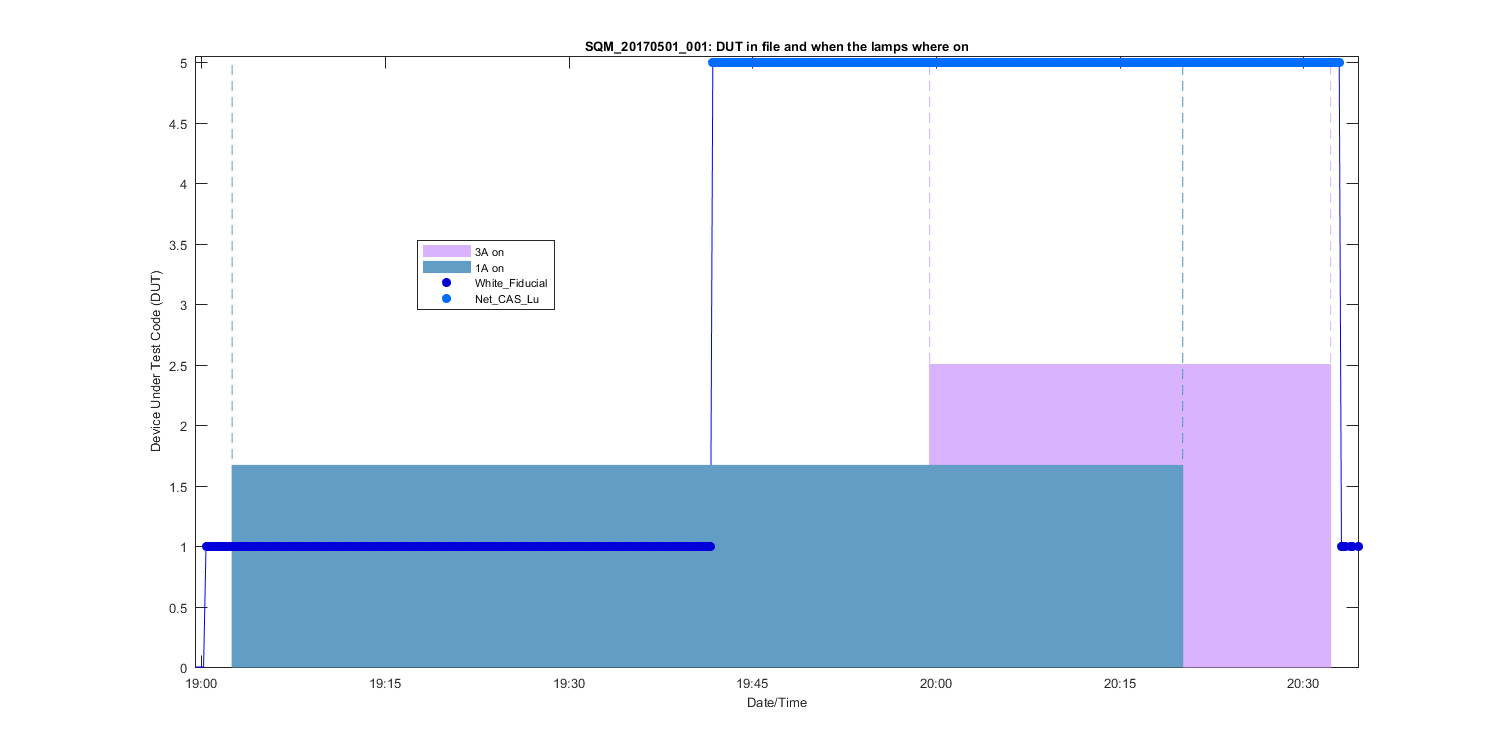
Figure 5
Figure 6
Figure 7
Figure 8
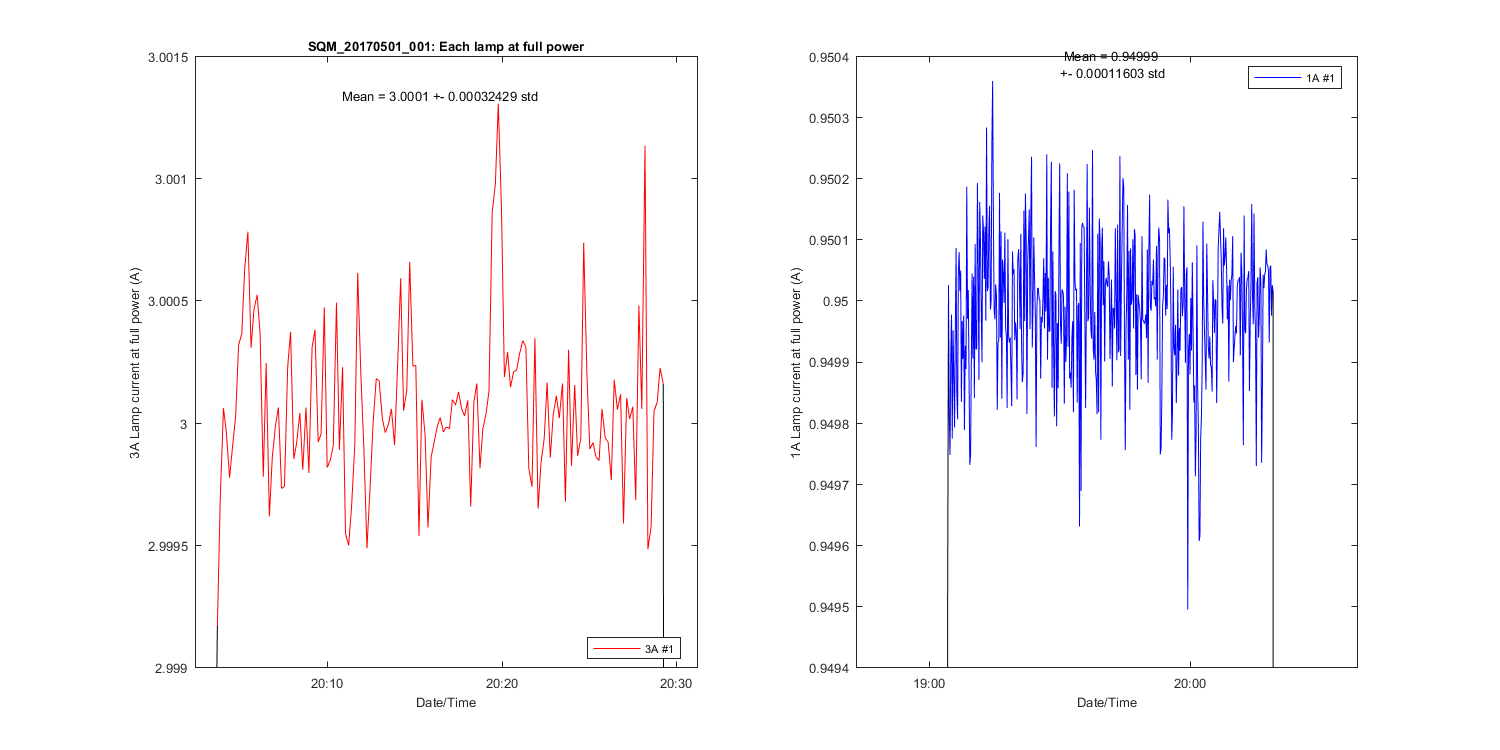
Figure 9
Figure 10