| Description | Value or Code |
|---|---|
| Cruise_Name:, Vaux(12,:) | NIST |
| Cruise_Number | 2017-002 |
| Investigator:: Vaux(16,:) | Carol Johnson |
| Location_of_Measurement: Vaux(17,:) | NIST B019_221 |
| Purpose: Vaux(18,:) | Stability Measurement |
| MOBY_NET_Sequence_Position: Vaux(20,:) | Calibration Facility |
| Ambient_Air_Temp (deg C) | 22.8 |
| Relative_Humidity (%) | 21.4 |
| #_of_Levels | 3 |
| Time_Step (sec) | 10 |
| Initial lamp state: Vaux(40,:) | All Off |
| Time_adjustment_to_GMT | 0 |
| Time_of_Last_Servicing | 20151218 |
| SQM_120VAC_On | 20170508.223000 |
| SQM_Off_to_Standby | 20170508.223038 |
| SQM_Standby_to_Off | 20170508.235238 |
| SQM_120VAC_Off | 20170508.235310 |
| Lamp 1 A burn hours | 0.77944 |
| Lamp 3 A burn hours | 0.54028 |
| DAQ_Program_Version | 0 |
| File Format Version | 2 |
| DAQ_Computer: Vaux(60,:) | EOS EQUIP 13 |
| DAQ_Program_Name: Vaux(61,:) | SQM Monitor_2.0.vi |
|
All Devices Under Test in the DUT column in DATA: DUT_White_Fiducial DUT_Net_CAS_Lu DUT_VXR |
|
ASCII SQM file data: SQM_20170508_001.txt
ASCII SQM file data: PDF log file
| Lamp | On/Off # | N | Time on (hrs) | Mean (meas./set) | std | %std |
|---|---|---|---|---|---|---|
| Lamp 1A | 1 | 253 | 0.73583 | 0.95 / 0.95 | 0.00011519 | 0.012126 |
| Lamp 3A | 1 | 146 | 0.42333 | 3.0001 / 3 | 0.0018153 | 0.060506 |
| Level | PD internal monitor (V) | Level Change # | Mean | std | %std |
|---|---|---|---|---|---|
| Low (1A) | Red | 1 | 0.24173 | 0.072331 | 29.9219 |
| Low (1A) | White | 1 | 0.23594 | 0.069376 | 30.6567 |
| Low (1A) | Blue | 1 | 0.20631 | 0.03794 | 35.0602 |
| Medium (3A) | Red | 3 | 1.3287 | 0.13694 | 10.3063 |
| Medium (3A) | White | 3 | 1.4211 | 0.14882 | 9.6364 |
| Medium (3A) | Blue | 3 | 1.4148 | 0.098781 | 9.6795 |
| Level | Temperature (C) | Level Change # | Mean | std | %std |
|---|---|---|---|---|---|
| Low (1A) | PD | 1 | 35.0085 | 0.10965 | 0.3132 |
| Medium (3A) | PD | 3 | 35.0518 | 0.09897 | 0.28235 |
Red PD (max value): 2.4864: #of possible satureated values 0
White PD (max value): 2.239: #of possible satureated values 0
Blue PD (max value): 2.2524: #of possible satureated values 0
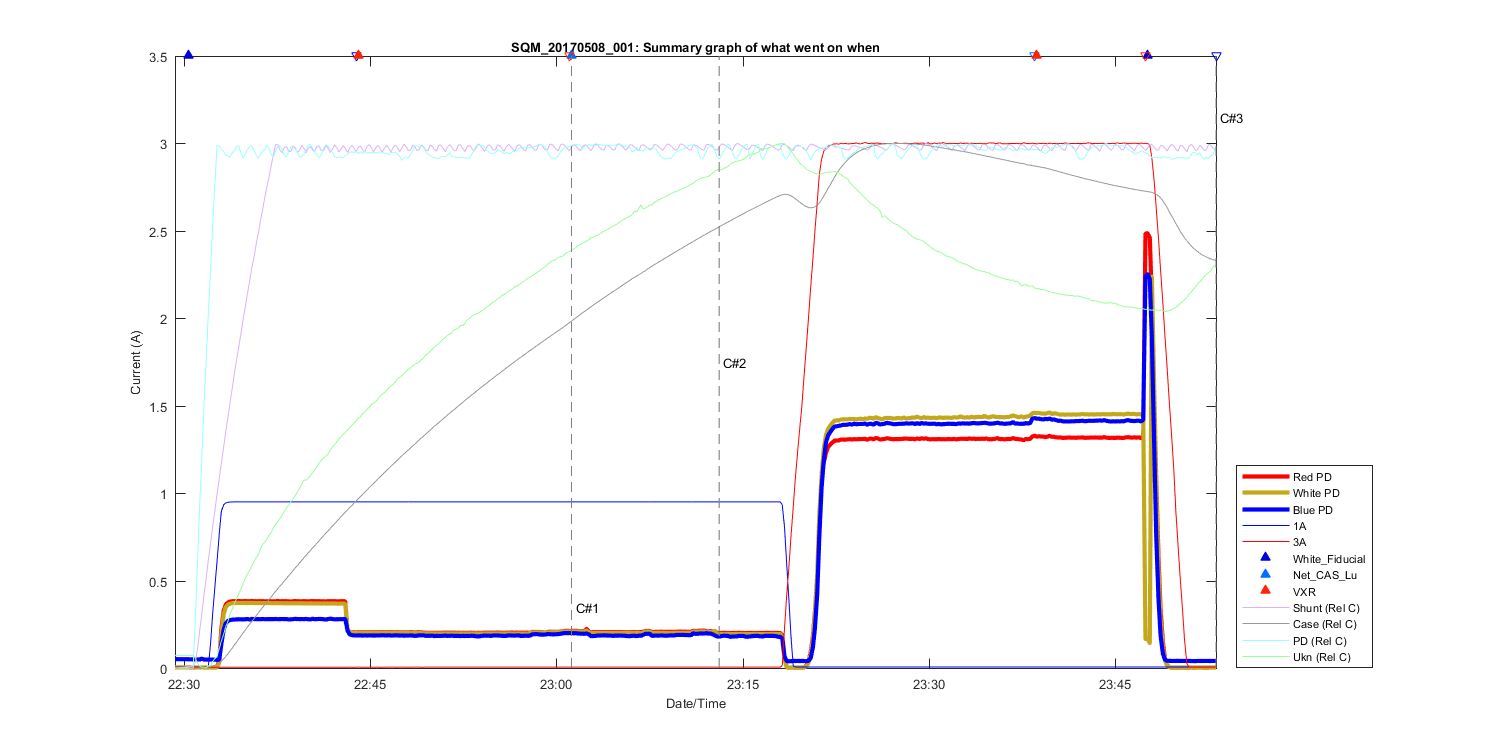
Figure 1
Summary Graph showing all measurements taken in this file, including auxilliary temperature measurements and comments. The text C# shows what time in the file the comments (shown above where made). The triangles at the top of the figure shows then a DUT (Device under test) was placed in front of the SQM and removed.
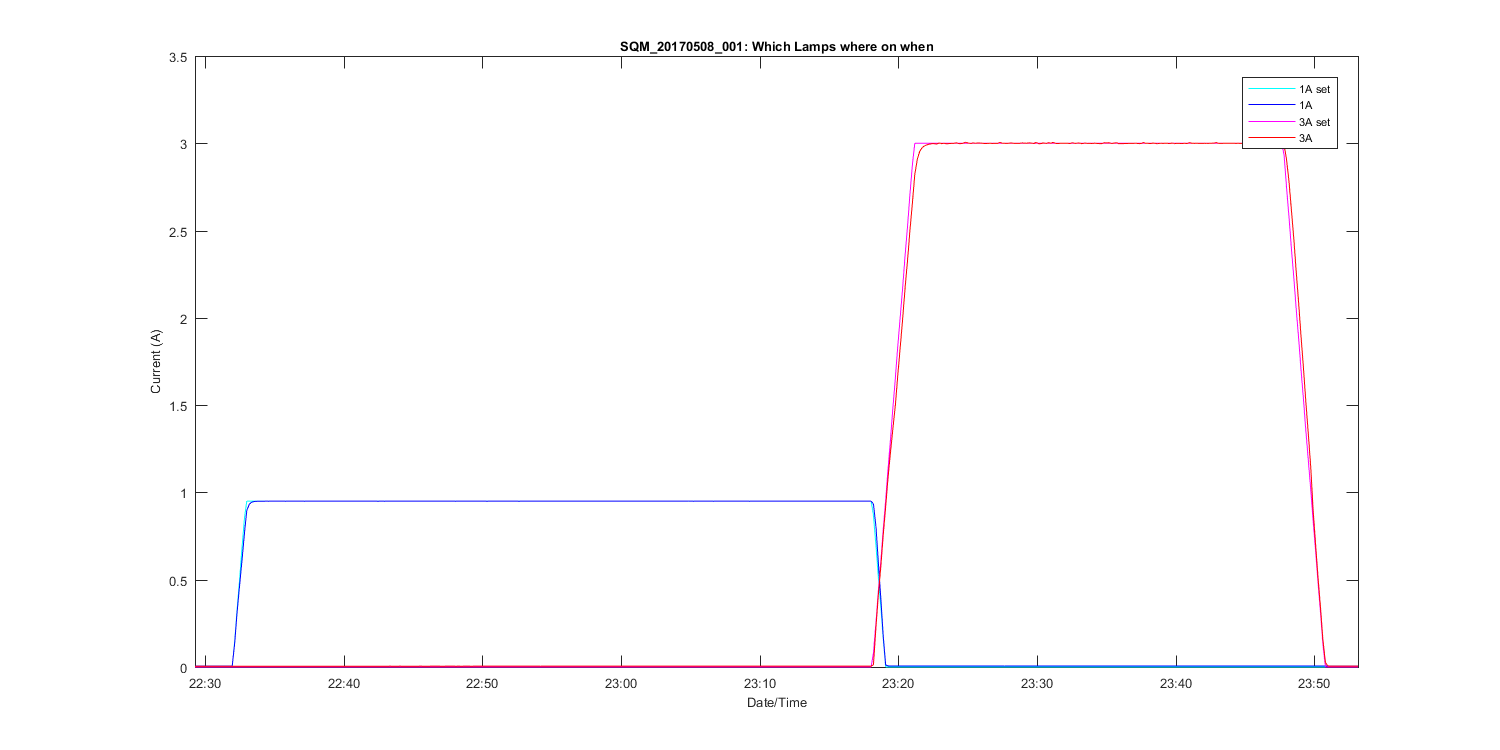
Figure 2
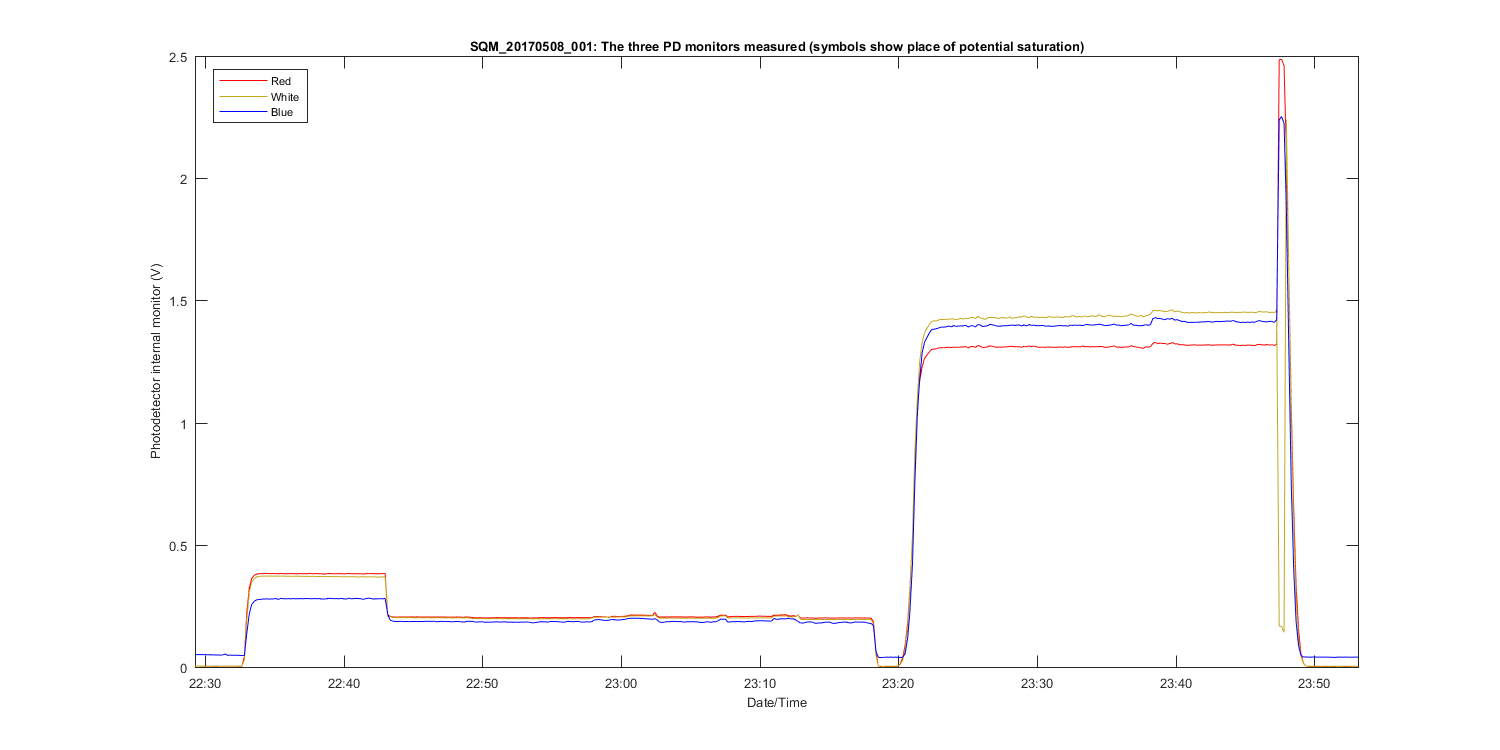
Figure 3
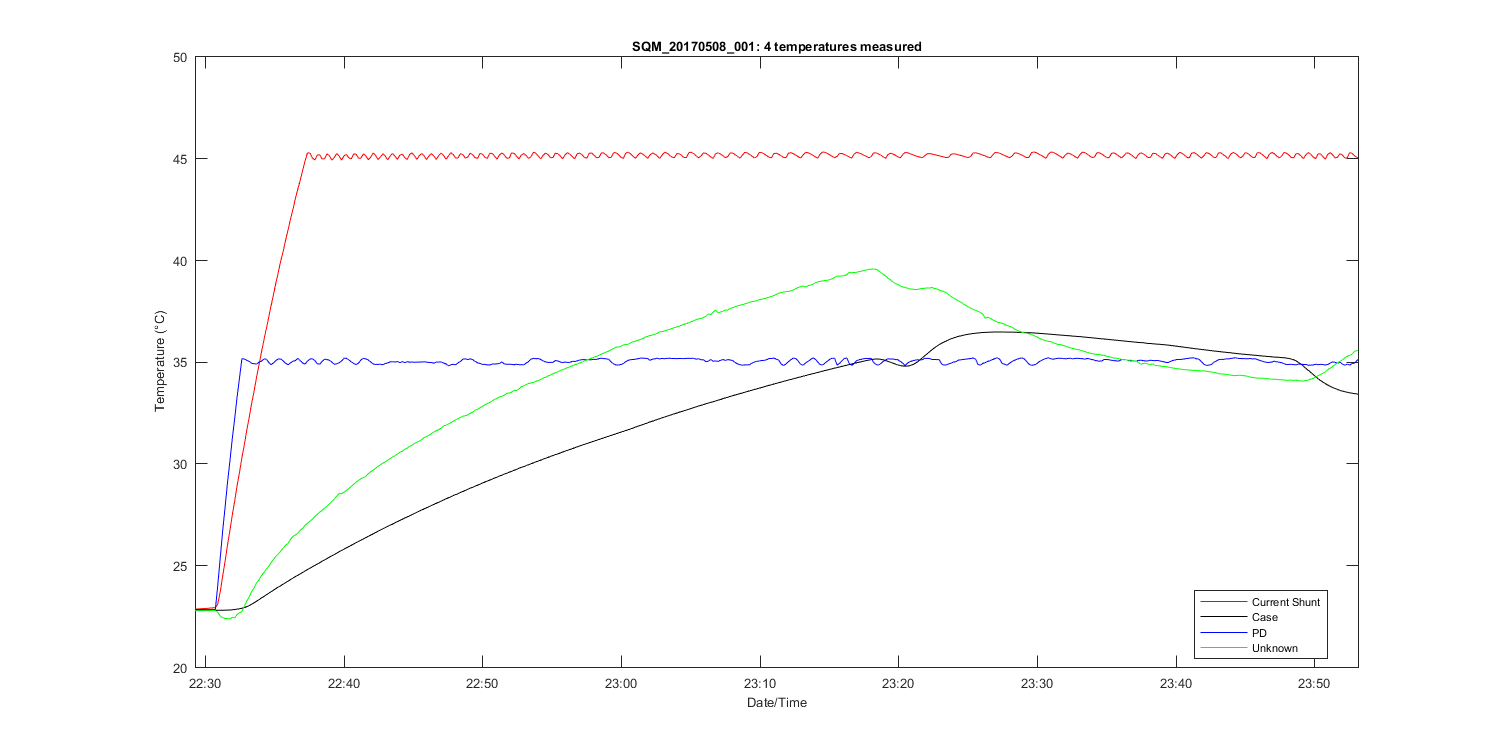
Figure 4
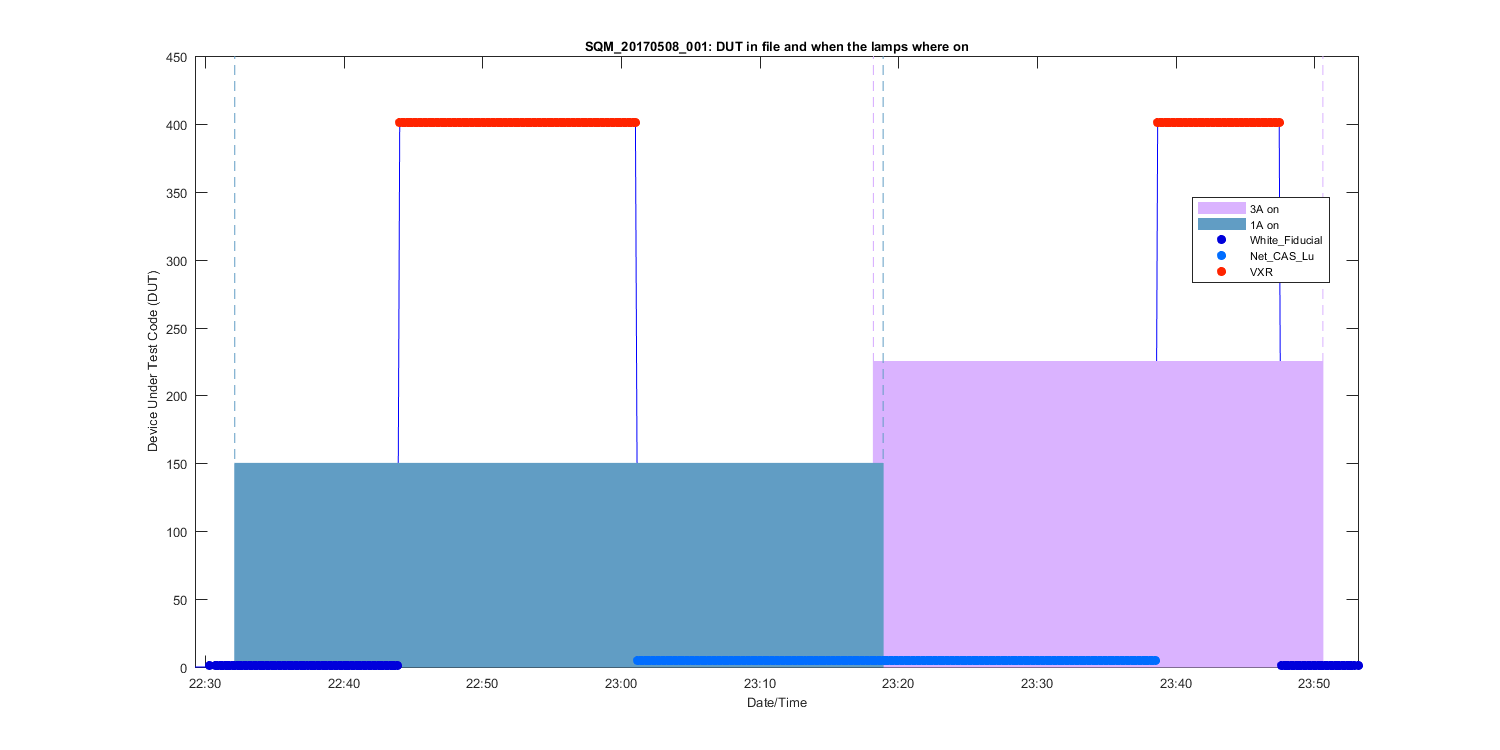
Figure 5
Figure 6
Figure 7
Figure 8
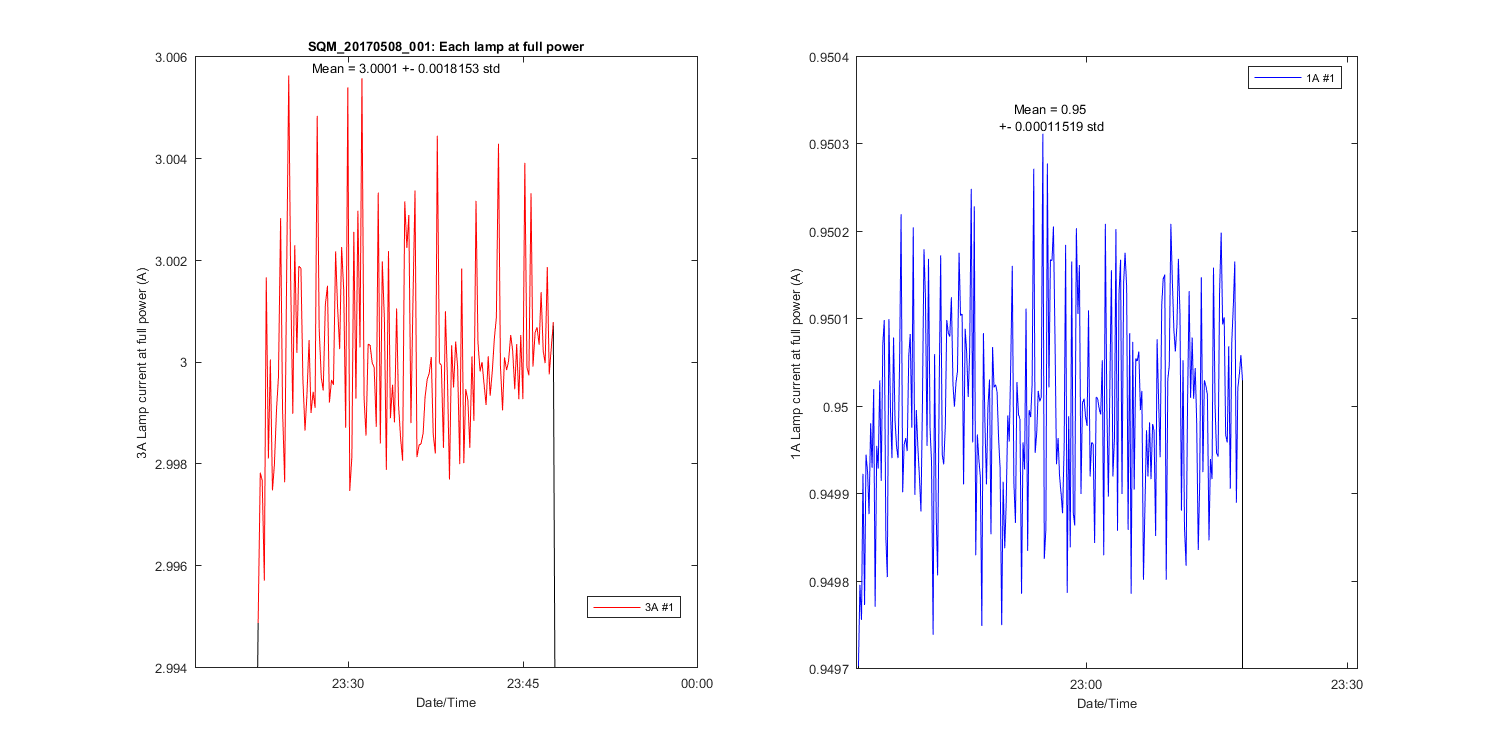
Figure 9
Figure 10