| Description | Value or Code |
|---|---|
| Cruise_Name:, Vaux(12,:) | NIST |
| Cruise_Number | 2017-002 |
| Investigator:: Vaux(16,:) | Carol Johnson |
| Location_of_Measurement: Vaux(17,:) | NIST B019_221 |
| Purpose: Vaux(18,:) | Stability Measurement |
| MOBY_NET_Sequence_Position: Vaux(20,:) | Calibration Facility |
| Ambient_Air_Temp (deg C) | 22.8 |
| Relative_Humidity (%) | 43 |
| #_of_Levels | 3 |
| Time_Step (sec) | 10 |
| Initial lamp state: Vaux(40,:) | All Off |
| Time_adjustment_to_GMT | 0 |
| Time_of_Last_Servicing | 20151218 |
| SQM_120VAC_On | 20170606.192700 |
| SQM_Off_to_Standby | 20170606.193116 |
| SQM_Standby_to_Off | 20170606.210518 |
| SQM_120VAC_Off | 20170606.210700 |
| Lamp 1 A burn hours | 1.4689 |
| Lamp 3 A burn hours | 1.5039 |
| DAQ_Program_Version | 0 |
| File Format Version | 2 |
| DAQ_Computer: Vaux(60,:) | EOS EQUIP 13 |
| DAQ_Program_Name: Vaux(61,:) | SQM Monitor_2.0.vi |
|
All Devices Under Test in the DUT column in DATA: DUT_White_Fiducial DUT_Net_CAS_Lu DUT_VXR |
|
ASCII SQM file data: SQM_20170606_001.txt
ASCII SQM file data: PDF log file
| Lamp | On/Off # | N | Time on (hrs) | Mean (meas./set) | std | %std |
|---|---|---|---|---|---|---|
| Lamp 1A | 1 | 488 | 1.4222 | 0.94999 / 0.95 | 0.00012965 | 0.013647 |
| Lamp 3A | 1 | 475 | 1.3842 | 3 / 3 | 0.0010399 | 0.034664 |
| Level | PD internal monitor (V) | Level Change # | Mean | std | %std |
|---|---|---|---|---|---|
| High (1A & 3A) | Red | 1 | 1.4821 | 0.19293 | 13.0174 |
| High (1A & 3A) | White | 1 | 1.6065 | 0.2112 | 12.009 |
| High (1A & 3A) | Blue | 1 | 1.5365 | 0.20856 | 12.5562 |
| Level | Temperature (C) | Level Change # | Mean | std | %std |
|---|---|---|---|---|---|
| High (1A & 3A) | PD | 1 | 35.0104 | 0.10499 | 0.29989 |
Red PD (max value): 2.4834: #of possible satureated values 6
White PD (max value): 1.7858: #of possible satureated values 6
Blue PD (max value): 2.4976: #of possible satureated values 0
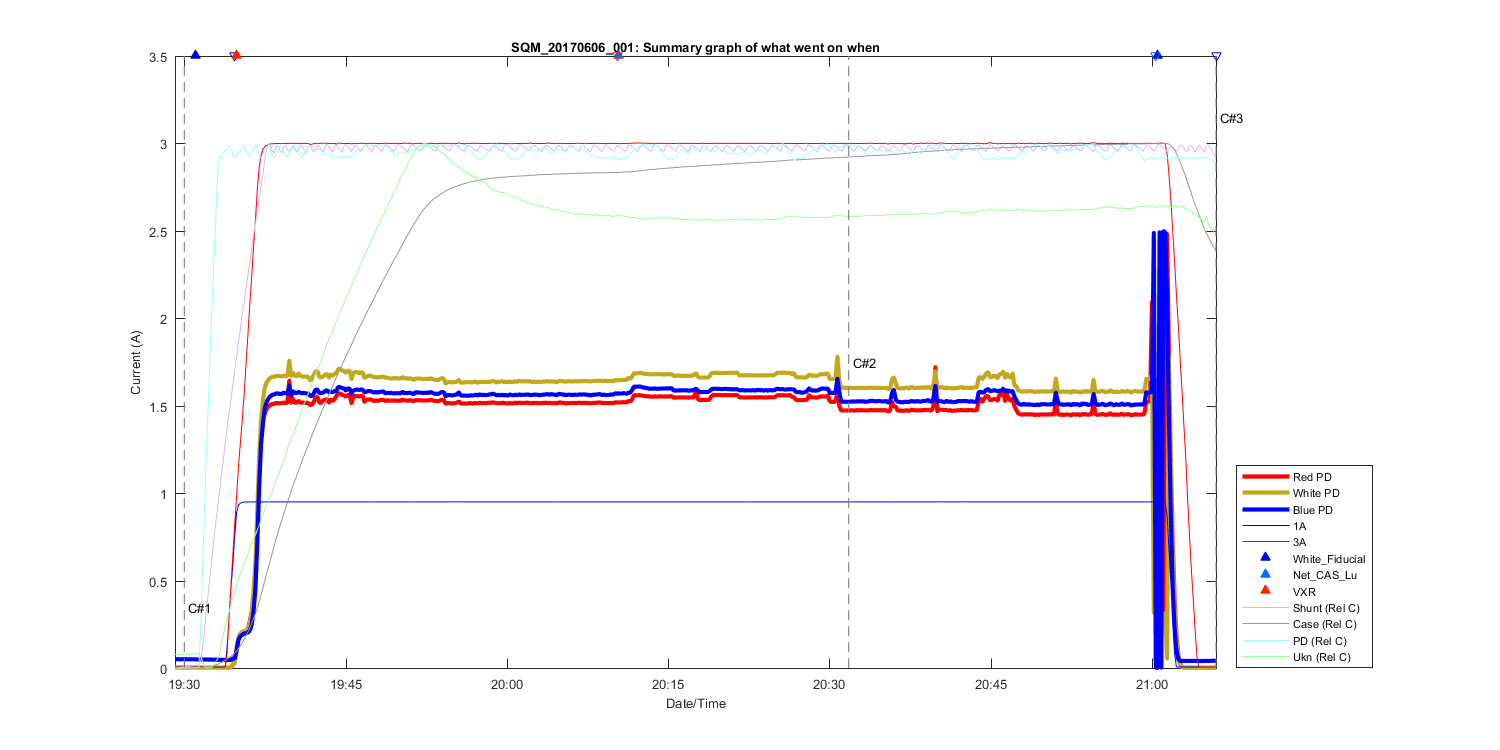
Figure 1
Summary Graph showing all measurements taken in this file, including auxilliary temperature measurements and comments. The text C# shows what time in the file the comments (shown above where made). The triangles at the top of the figure shows then a DUT (Device under test) was placed in front of the SQM and removed.
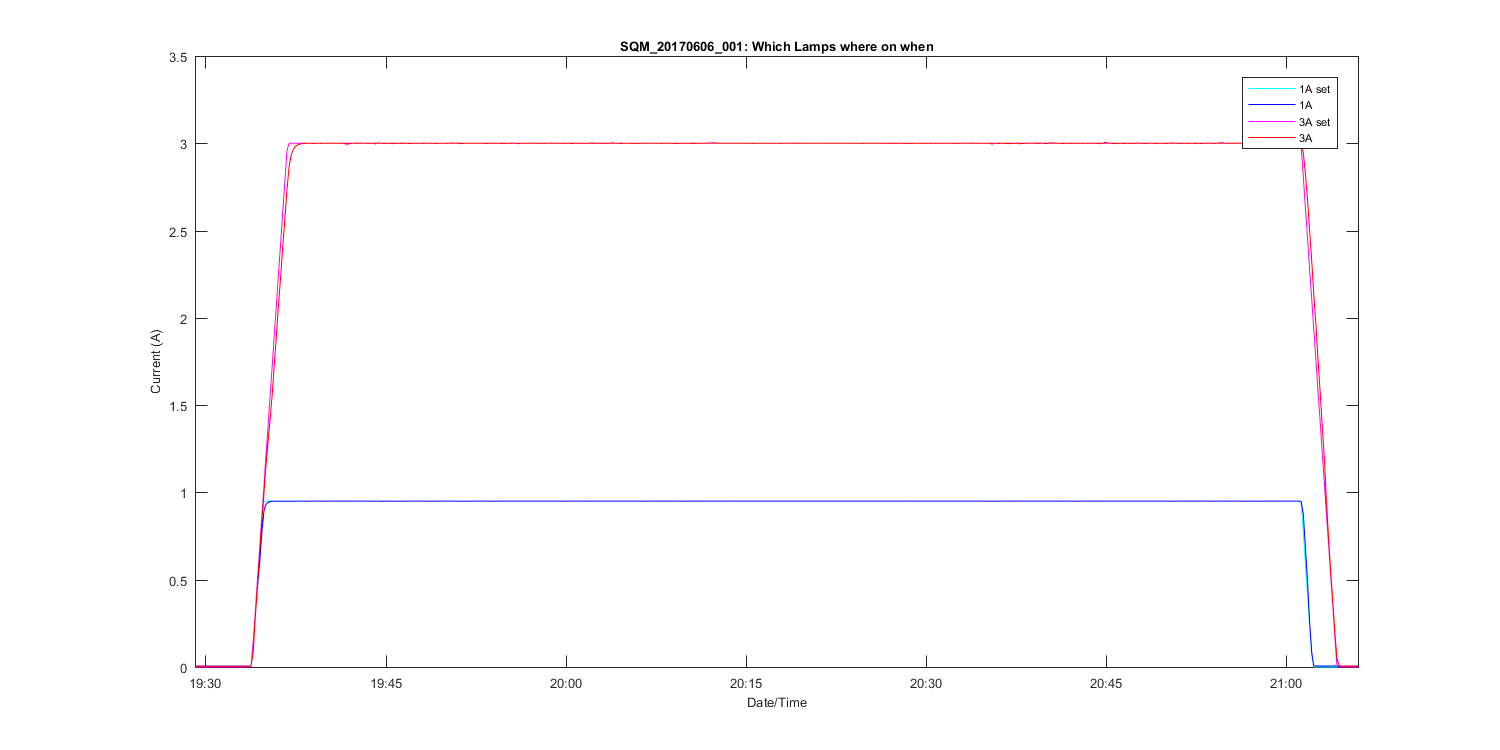
Figure 2
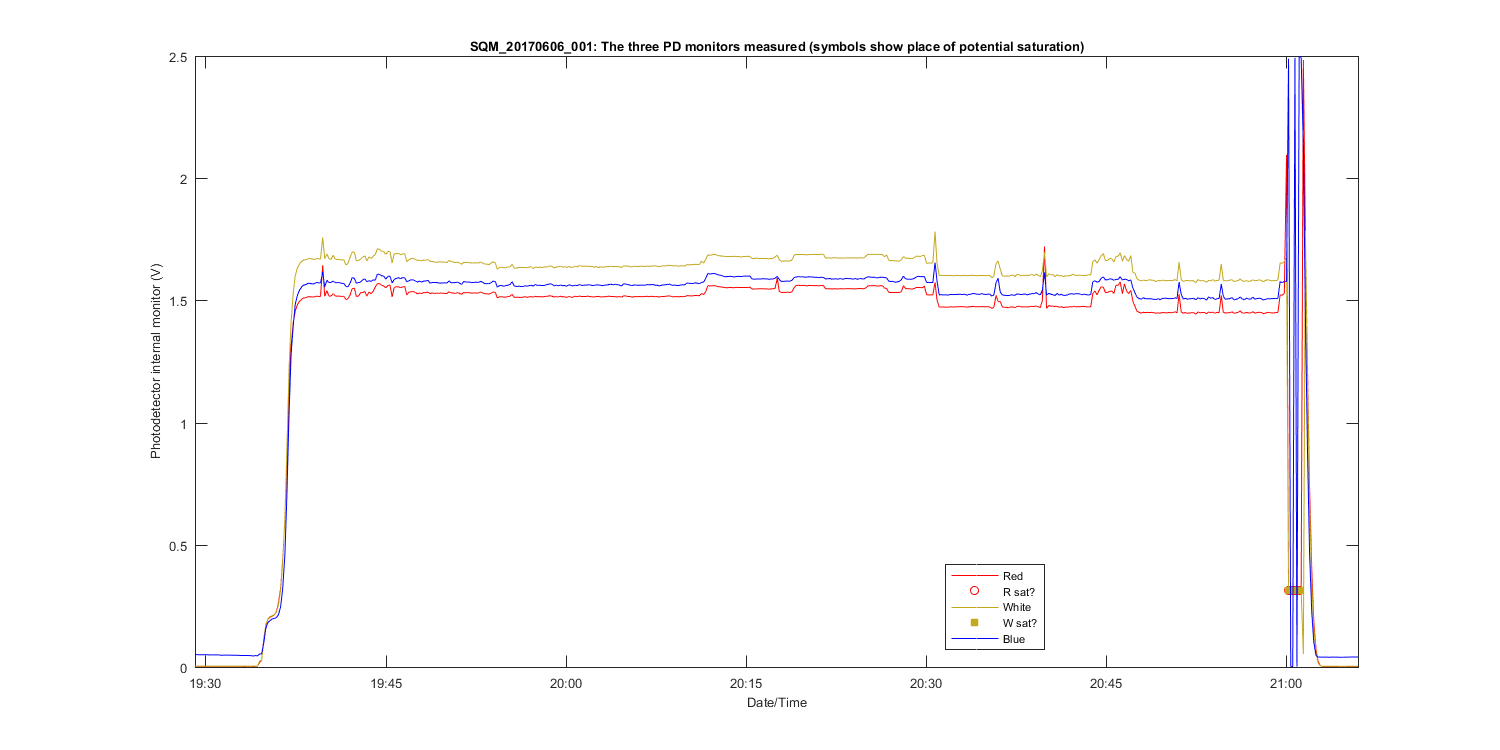
Figure 3
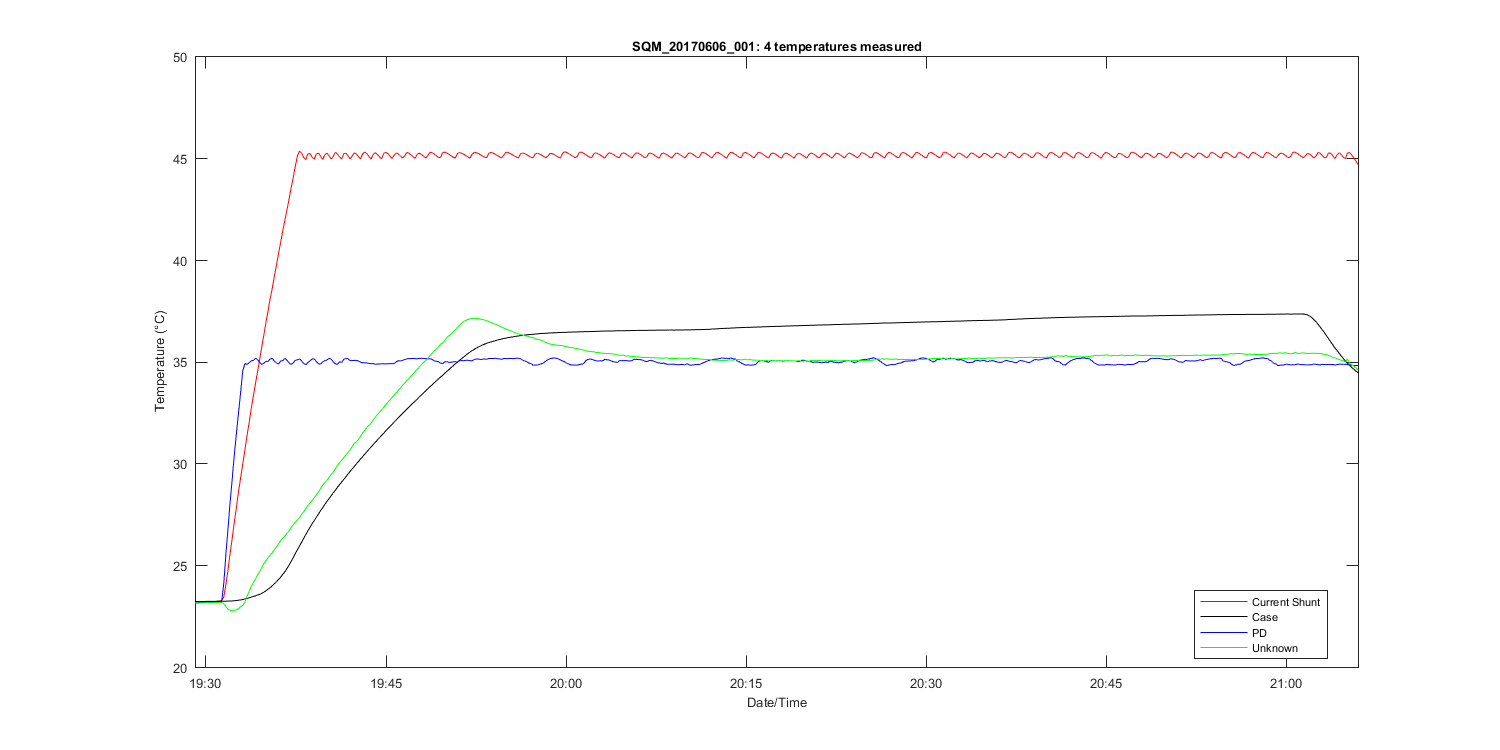
Figure 4
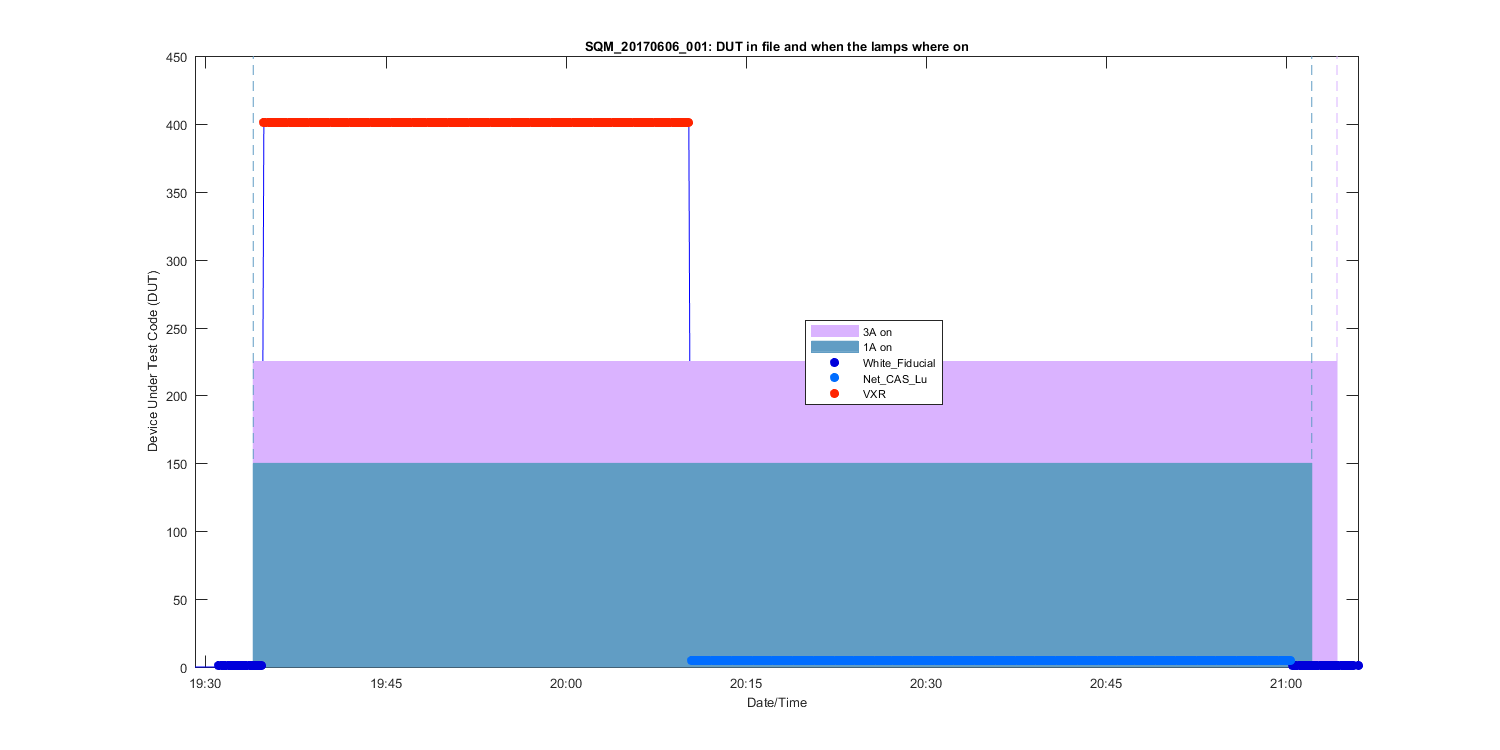
Figure 5
Figure 6
Figure 7
Figure 8
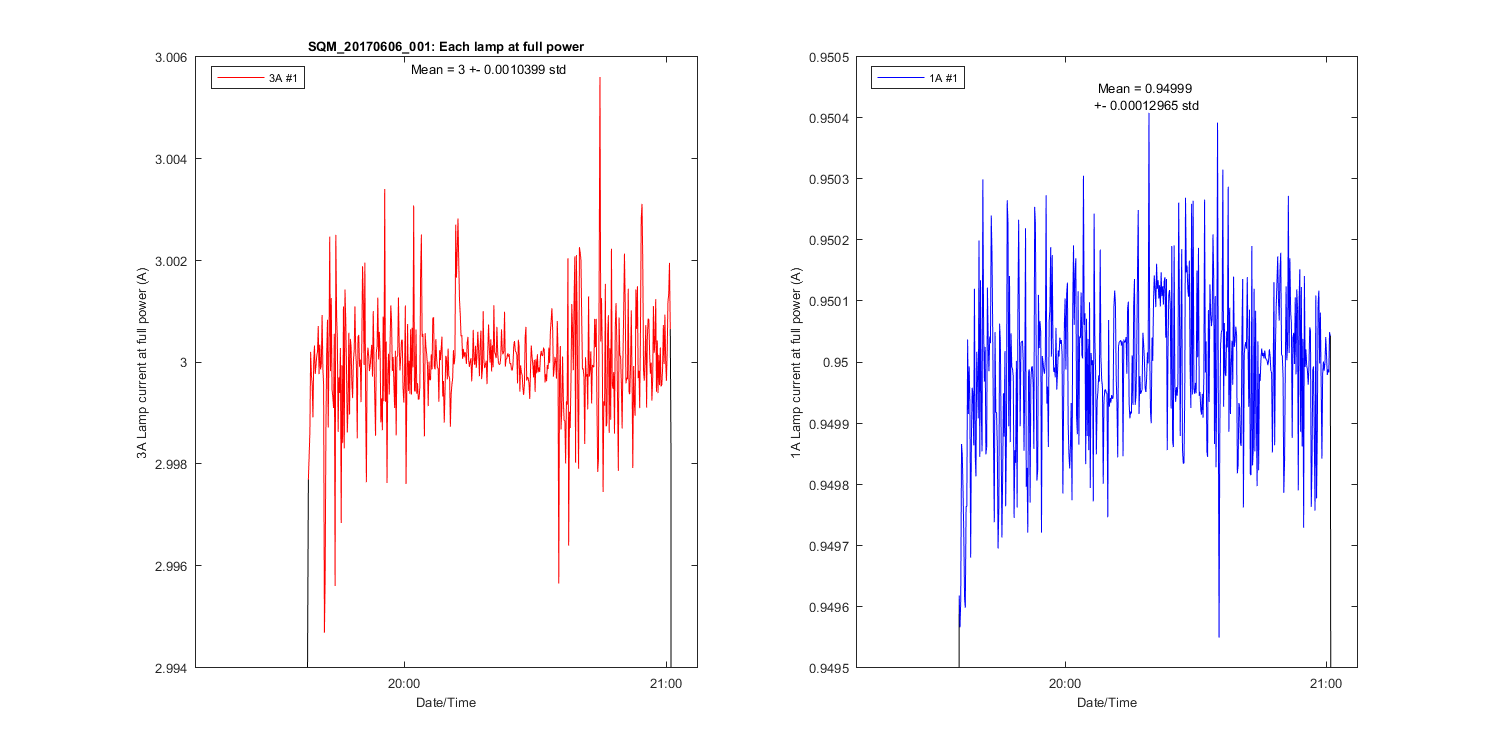
Figure 9
Figure 10