| Description | Value or Code |
|---|---|
| Cruise_Name:, Vaux(12,:) | NIST |
| Cruise_Number | 2017-002 |
| Investigator:: Vaux(16,:) | Carol Johnson |
| Location_of_Measurement: Vaux(17,:) | NIST B019_221 |
| Purpose: Vaux(18,:) | Stability Measurement |
| MOBY_NET_Sequence_Position: Vaux(20,:) | Calibration Facility |
| Ambient_Air_Temp (deg C) | 23.1 |
| Relative_Humidity (%) | 50.5 |
| #_of_Levels | 4 |
| Time_Step (sec) | 10 |
| Initial lamp state: Vaux(40,:) | All Off |
| Time_adjustment_to_GMT | 0 |
| Time_of_Last_Servicing | 20151218 |
| SQM_120VAC_On | 20170714.153100 |
| SQM_Off_to_Standby | 20170714.154700 |
| SQM_Standby_to_Off | 20170714.201844 |
| SQM_120VAC_Off | 20170714.202000 |
| Lamp 1 A burn hours | 2.1581 |
| Lamp 3 A burn hours | 1.8631 |
| DAQ_Program_Version | 0 |
| File Format Version | 2 |
| DAQ_Computer: Vaux(60,:) | EOS EQUIP 13 |
| DAQ_Program_Name: Vaux(61,:) | SQM Monitor_2.0.vi |
|
All Devices Under Test in the DUT column in DATA: DUT_White_Fiducial DUT_Net_CAS_Lu DUT_VXR |
|
ASCII SQM file data: SQM_20170714_001.txt
ASCII SQM file data: PDF log file
| Lamp | On/Off # | N | Time on (hrs) | Mean (meas./set) | std | %std |
|---|---|---|---|---|---|---|
| Lamp 1A | 1 | 296 | 0.86139 | 0.94998 / 0.95 | 0.00012511 | 0.013169 |
| Lamp 1A | 2 | 276 | 0.80306 | 0.94999 / 0.95 | 0.00011582 | 0.012192 |
| Lamp 1A | 3 | 121 | 0.35028 | 0.94999 / 0.95 | 0.00010712 | 0.011276 |
| Lamp 3A | 1 | 599 | 1.7464 | 3 / 3 | 0.0010317 | 0.034389 |
| Level | PD internal monitor (V) | Level Change # | Mean | std | %std |
|---|---|---|---|---|---|
| Low (1A) | Red | 1 | 0.29533 | 0.089711 | 30.377 |
| Low (1A) | White | 1 | 0.28137 | 0.082014 | 31.8838 |
| Low (1A) | Blue | 1 | 0.23286 | 0.047076 | 38.5267 |
| Medium (3A) | Red | 3 | 1.3212 | 0.0082945 | 0.62782 |
| Medium (3A) | White | 3 | 1.4467 | 0.013787 | 0.57333 |
| Medium (3A) | Blue | 3 | 1.4135 | 0.0089 | 0.58682 |
| High (1A & 3A) | Red | 4 | 1.5088 | 0.042099 | 2.7902 |
| High (1A & 3A) | White | 4 | 1.6388 | 0.042306 | 2.5689 |
| High (1A & 3A) | Blue | 4 | 1.5573 | 0.035335 | 2.7034 |
| Medium (3A) | Red | 5 | 1.2863 | 0.0028046 | 0.21804 |
| Medium (3A) | White | 5 | 1.4182 | 0.0034674 | 0.19775 |
| Medium (3A) | Blue | 5 | 1.3796 | 0.0038281 | 0.2033 |
| High (1A & 3A) | Red | 6 | 0.19763 | 0.00016023 | 0.081074 |
| High (1A & 3A) | White | 6 | 0.19395 | 0.00034495 | 0.082614 |
| High (1A & 3A) | Blue | 6 | 0.1823 | 0.0006174 | 0.087891 |
| Low (1A) | Red | 7 | 0.28586 | 0.091531 | 32.0202 |
| Low (1A) | White | 7 | 0.27389 | 0.083363 | 33.4197 |
| Low (1A) | Blue | 7 | 0.2278 | 0.047785 | 40.1807 |
| Level | Temperature (C) | Level Change # | Mean | std | %std |
|---|---|---|---|---|---|
| Low (1A) | PD | 1 | 35.0252 | 0.11446 | 0.32681 |
| Medium (3A) | PD | 3 | 34.9373 | 0.11436 | 0.32733 |
| High (1A & 3A) | PD | 4 | 34.9756 | 0.12137 | 0.34701 |
| Medium (3A) | PD | 5 | 34.9032 | 0.098136 | 0.28117 |
| High (1A & 3A) | PD | 6 | 35.0094 | 0.067796 | 0.19365 |
| Low (1A) | PD | 7 | 35.0213 | 0.10476 | 0.29913 |
Red PD (max value): 1.5728: #of possible satureated values 0
White PD (max value): 1.706: #of possible satureated values 0
Blue PD (max value): 1.6058: #of possible satureated values 0
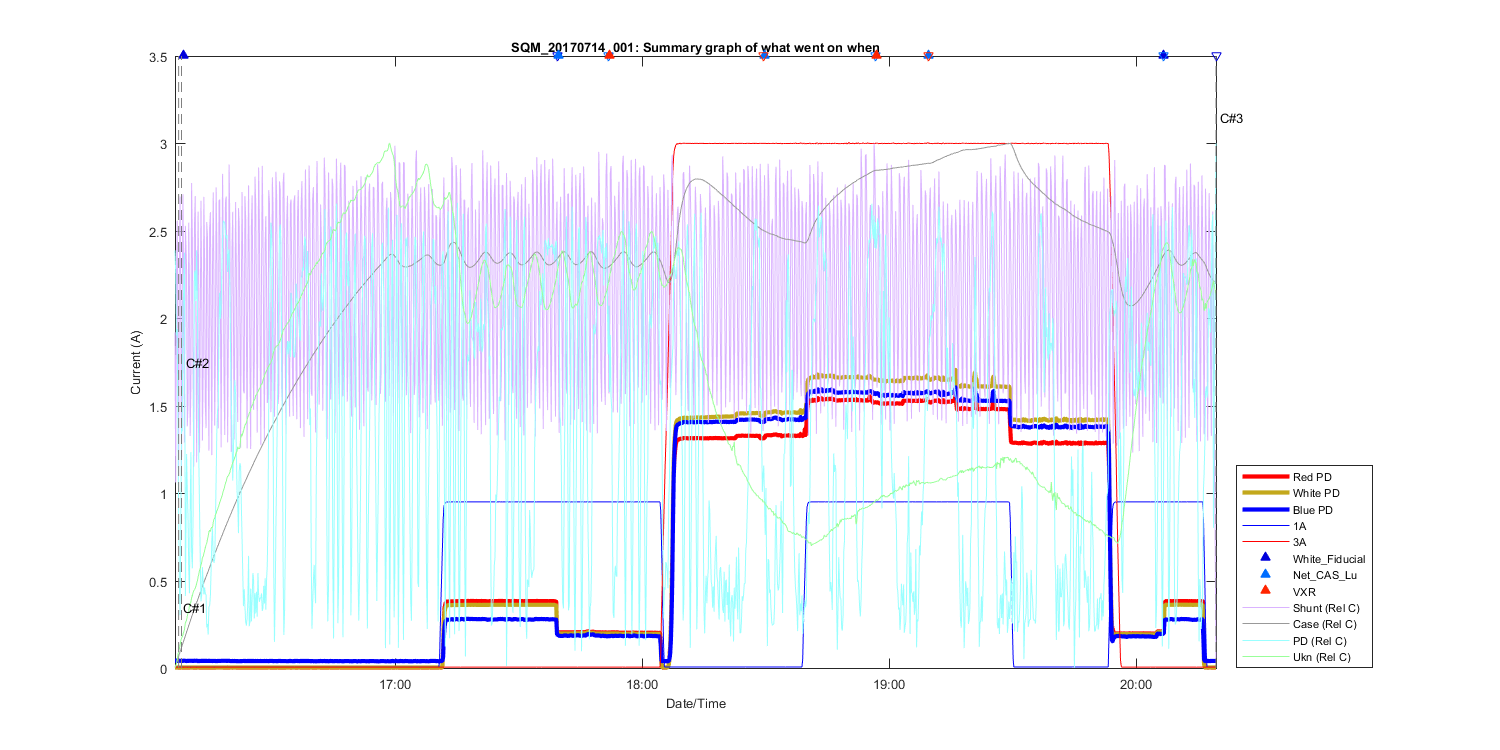
Figure 1
Summary Graph showing all measurements taken in this file, including auxilliary temperature measurements and comments. The text C# shows what time in the file the comments (shown above where made). The triangles at the top of the figure shows then a DUT (Device under test) was placed in front of the SQM and removed.
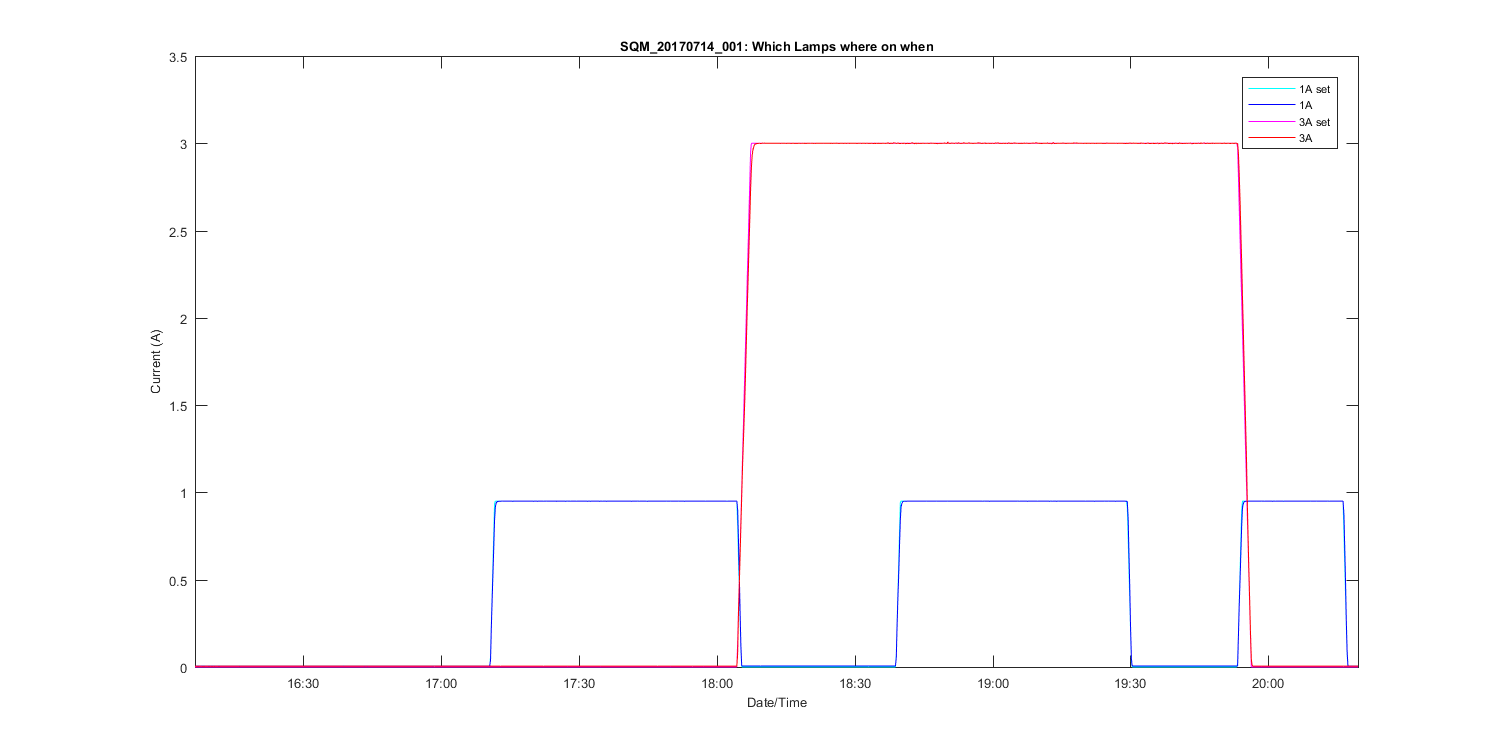
Figure 2
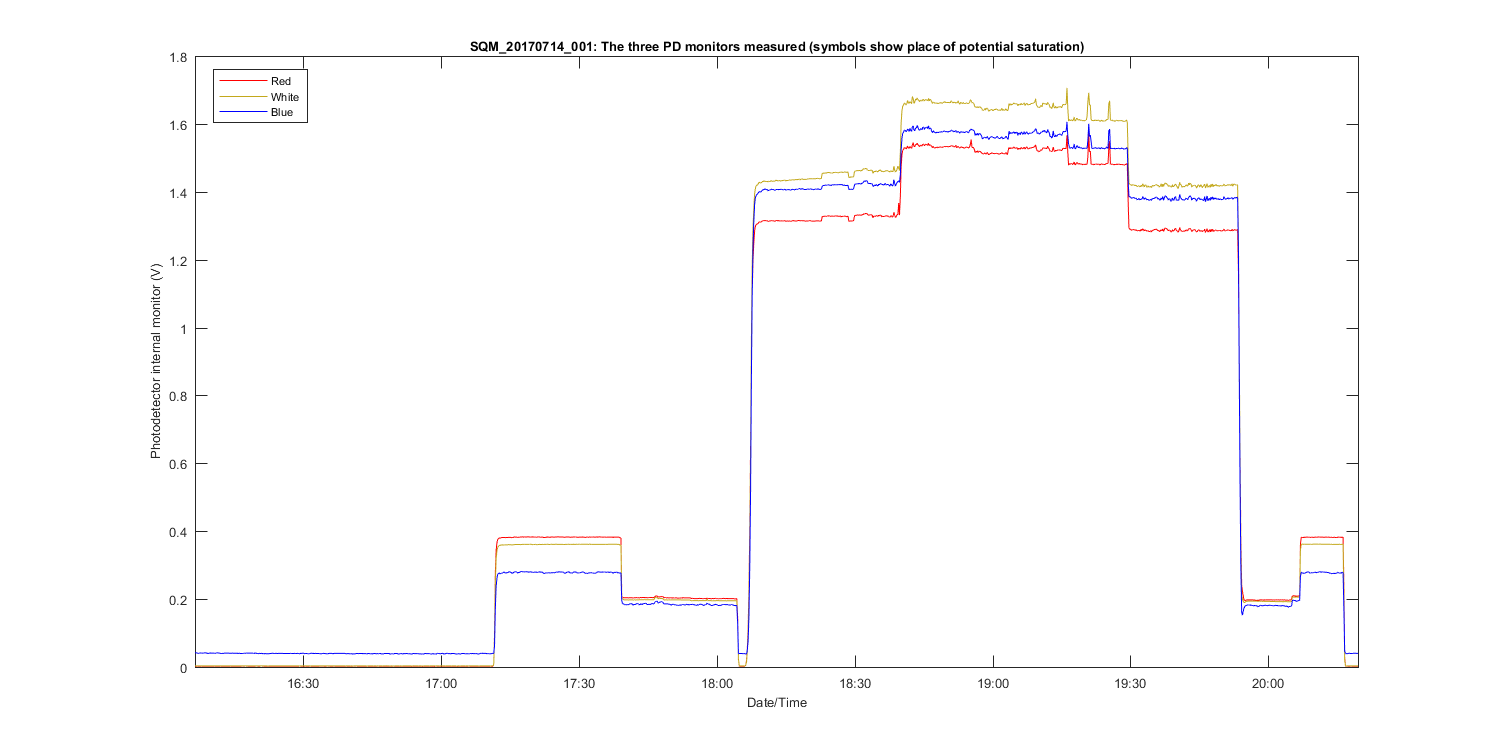
Figure 3
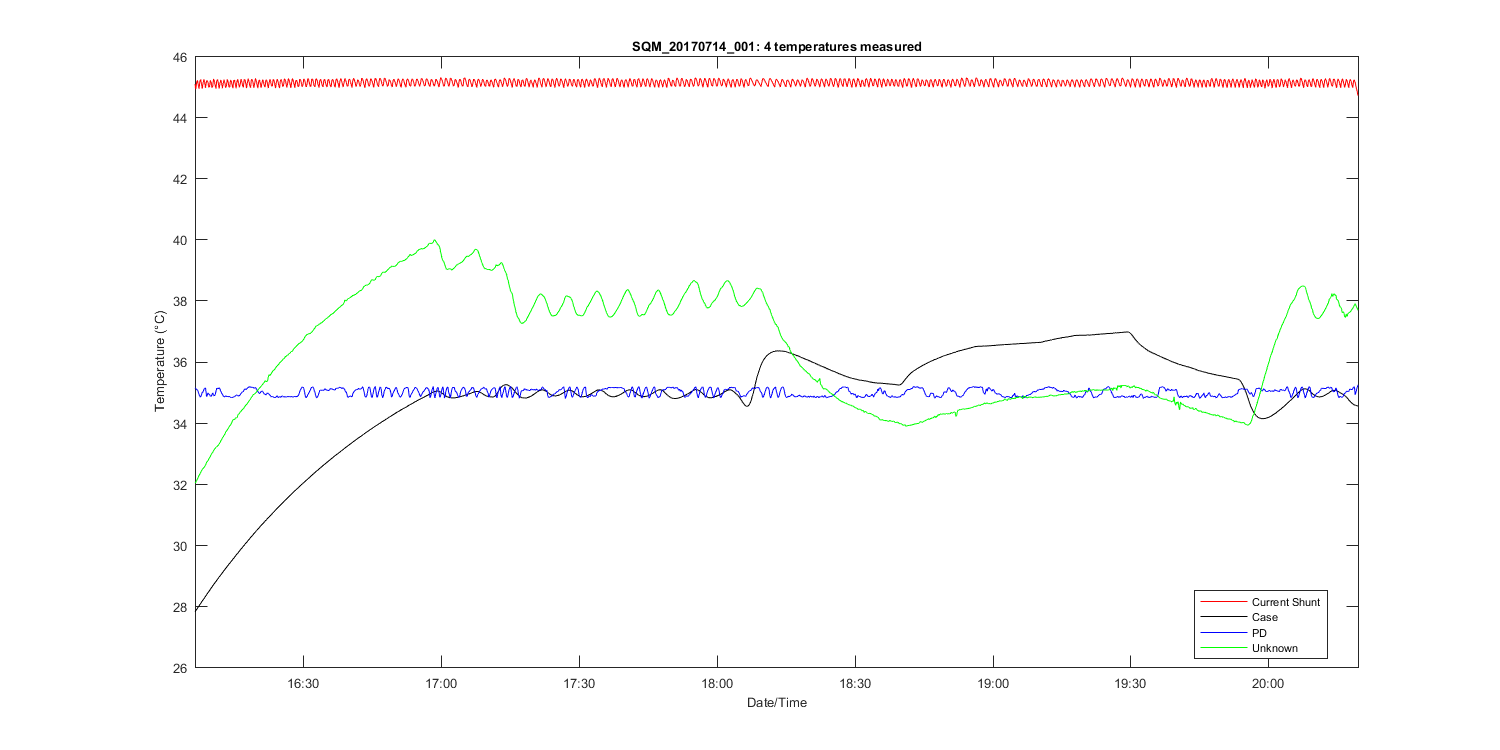
Figure 4
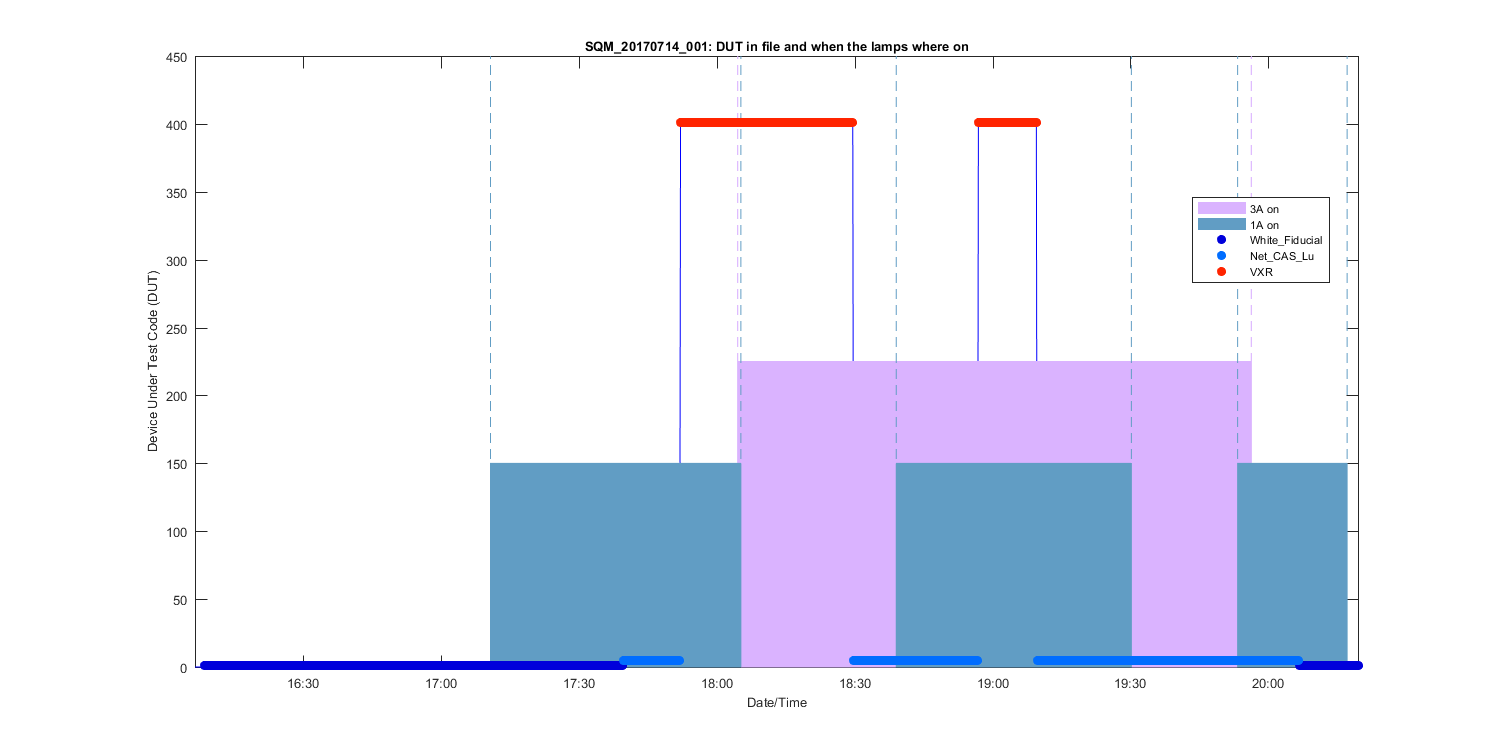
Figure 5
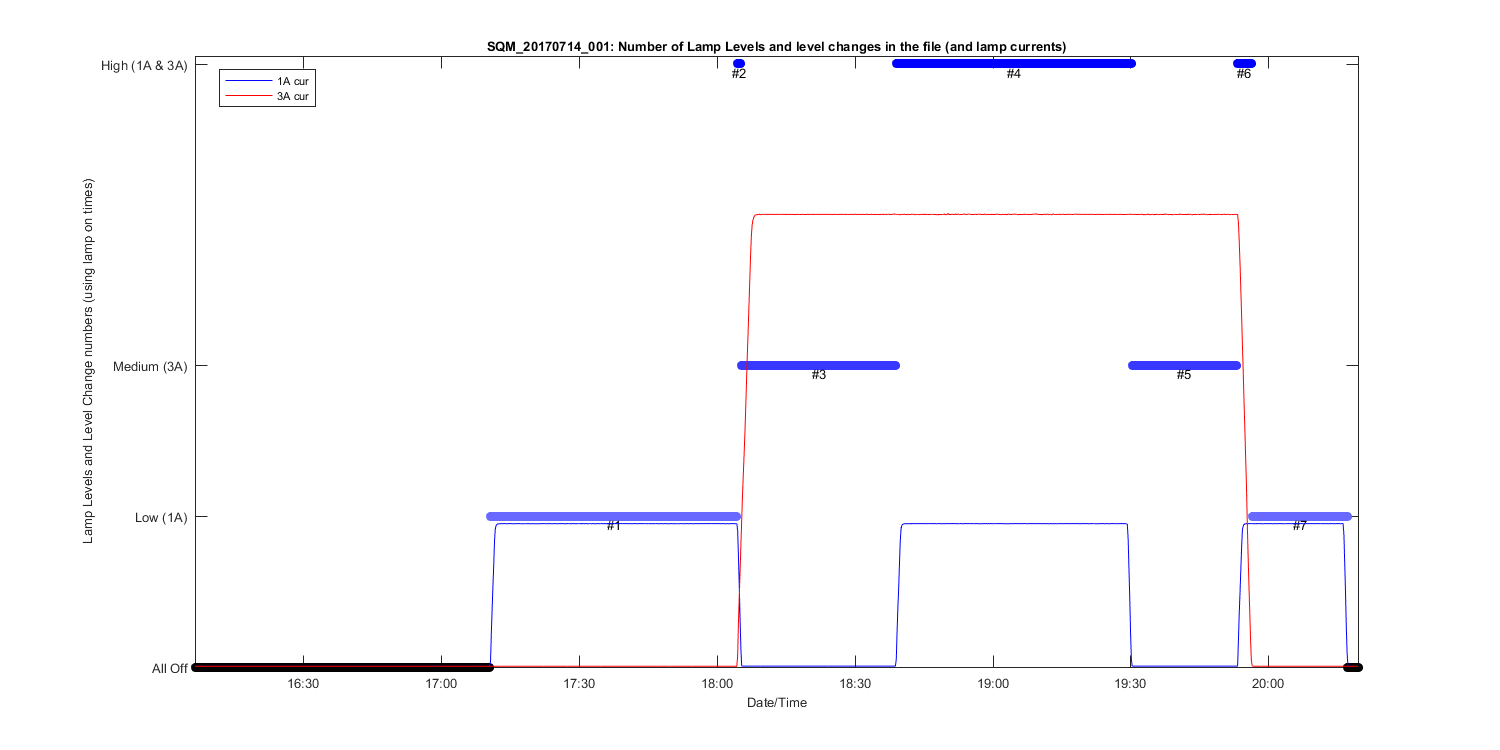
Figure 6
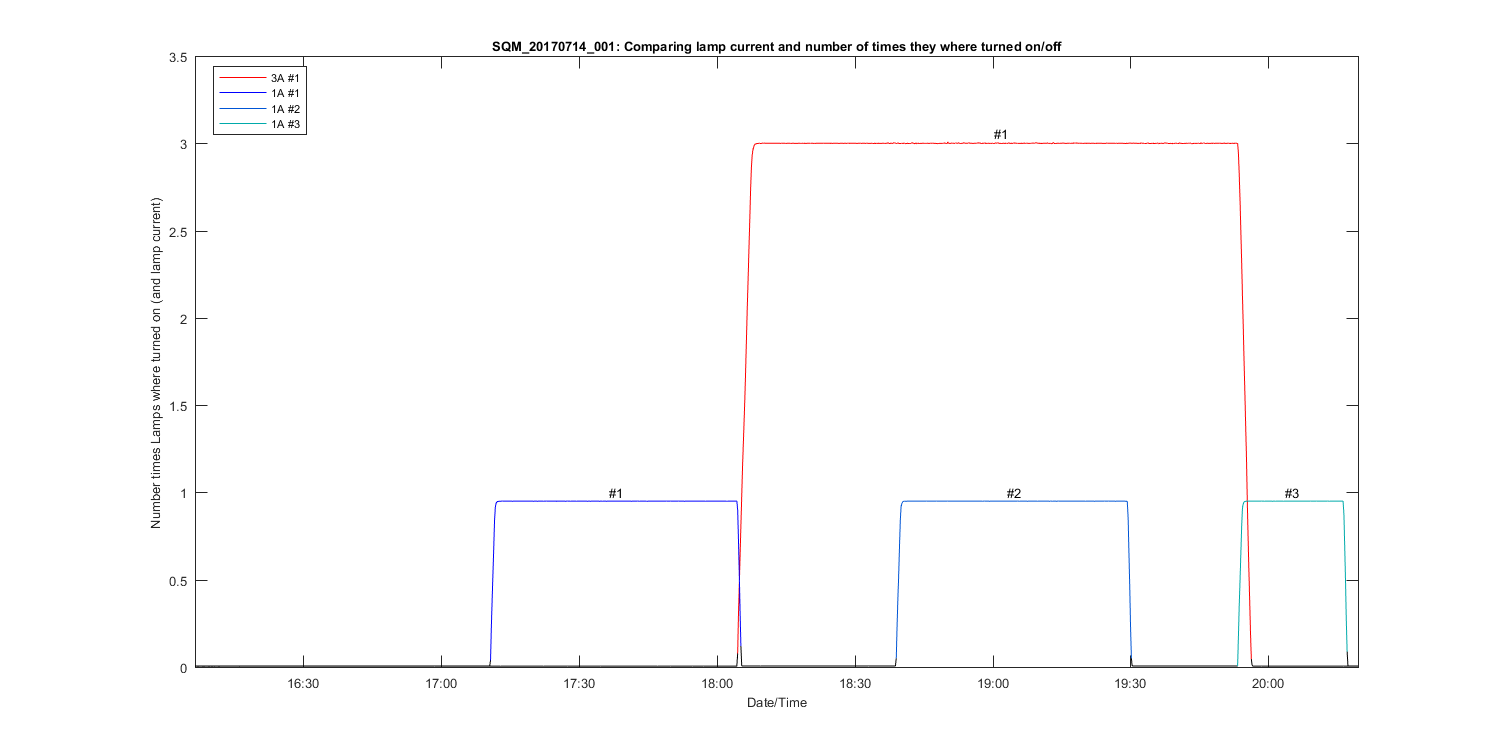
Figure 7
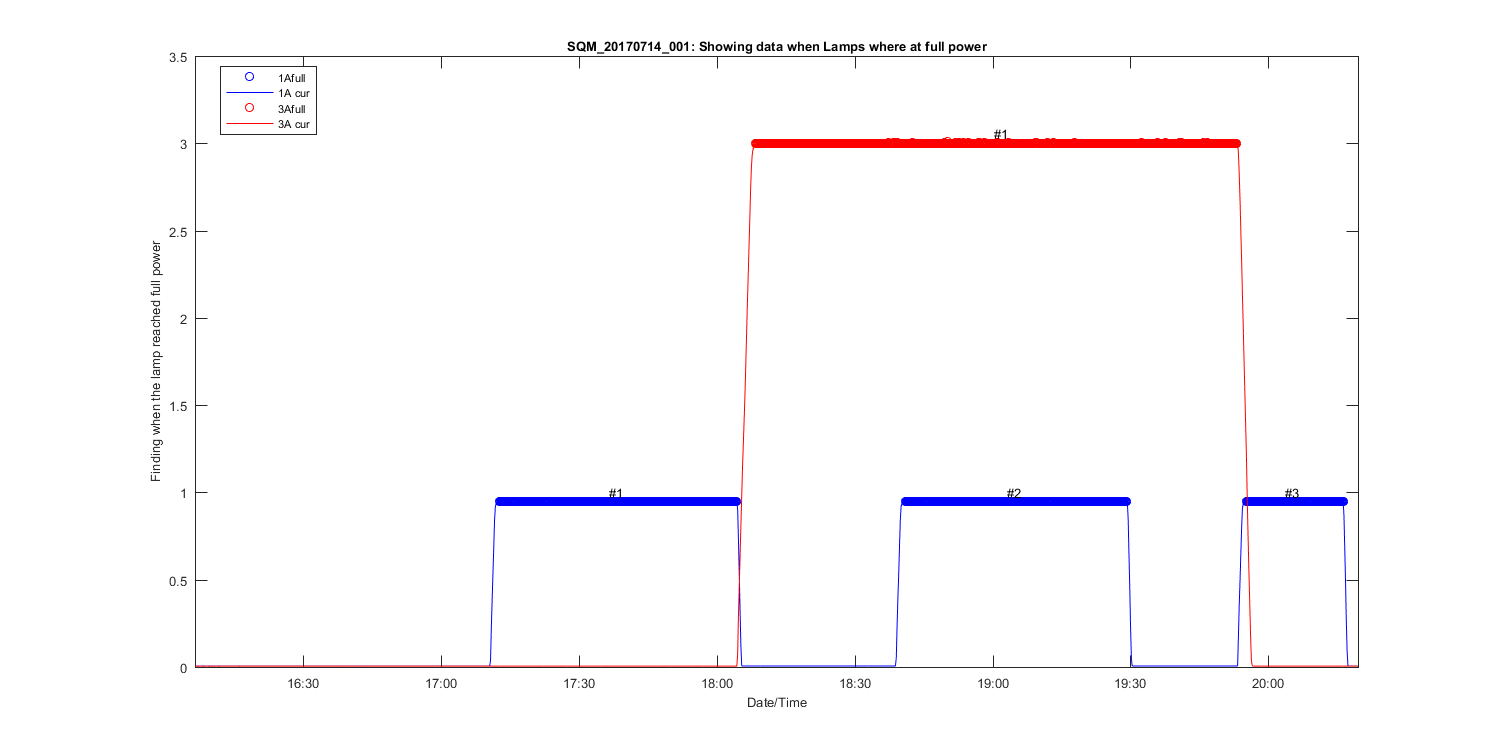
Figure 8
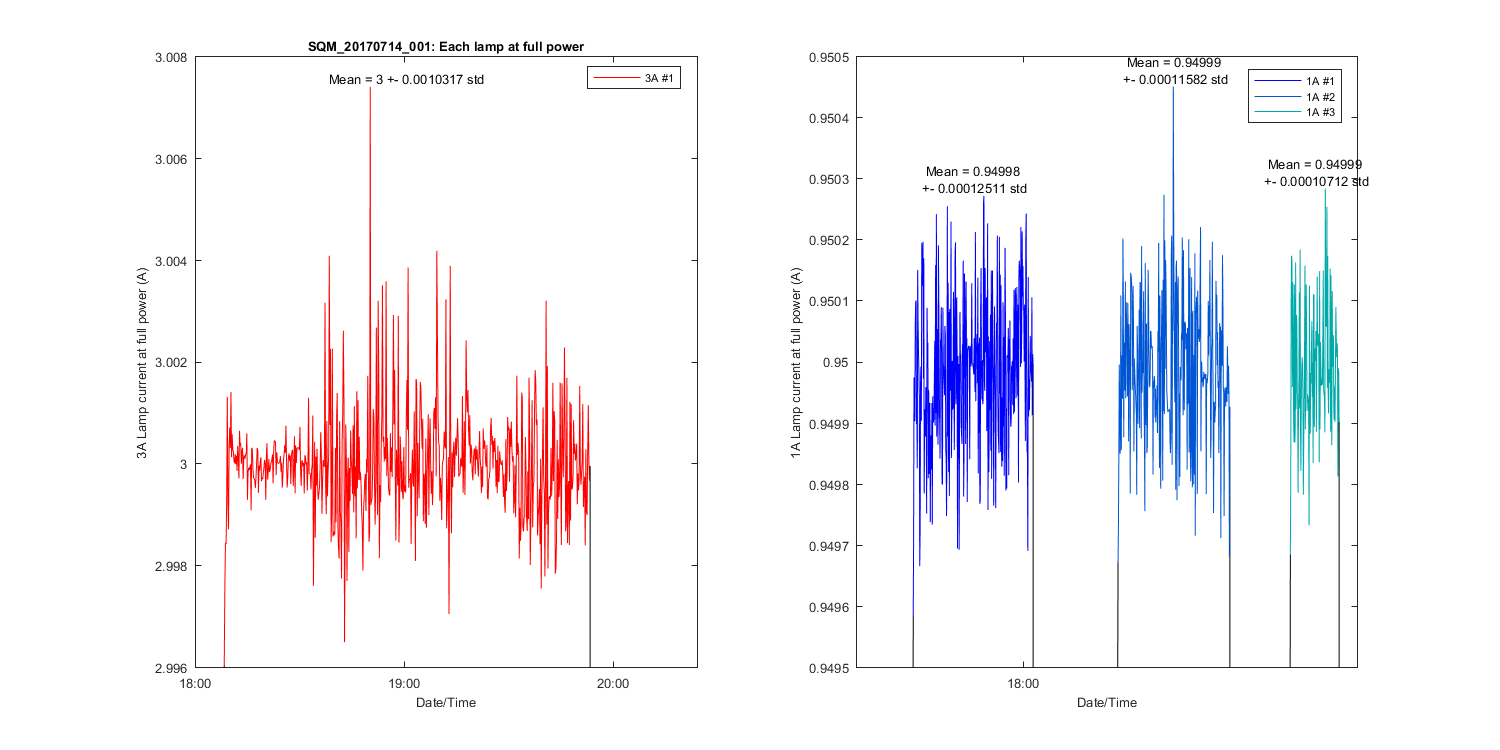
Figure 9
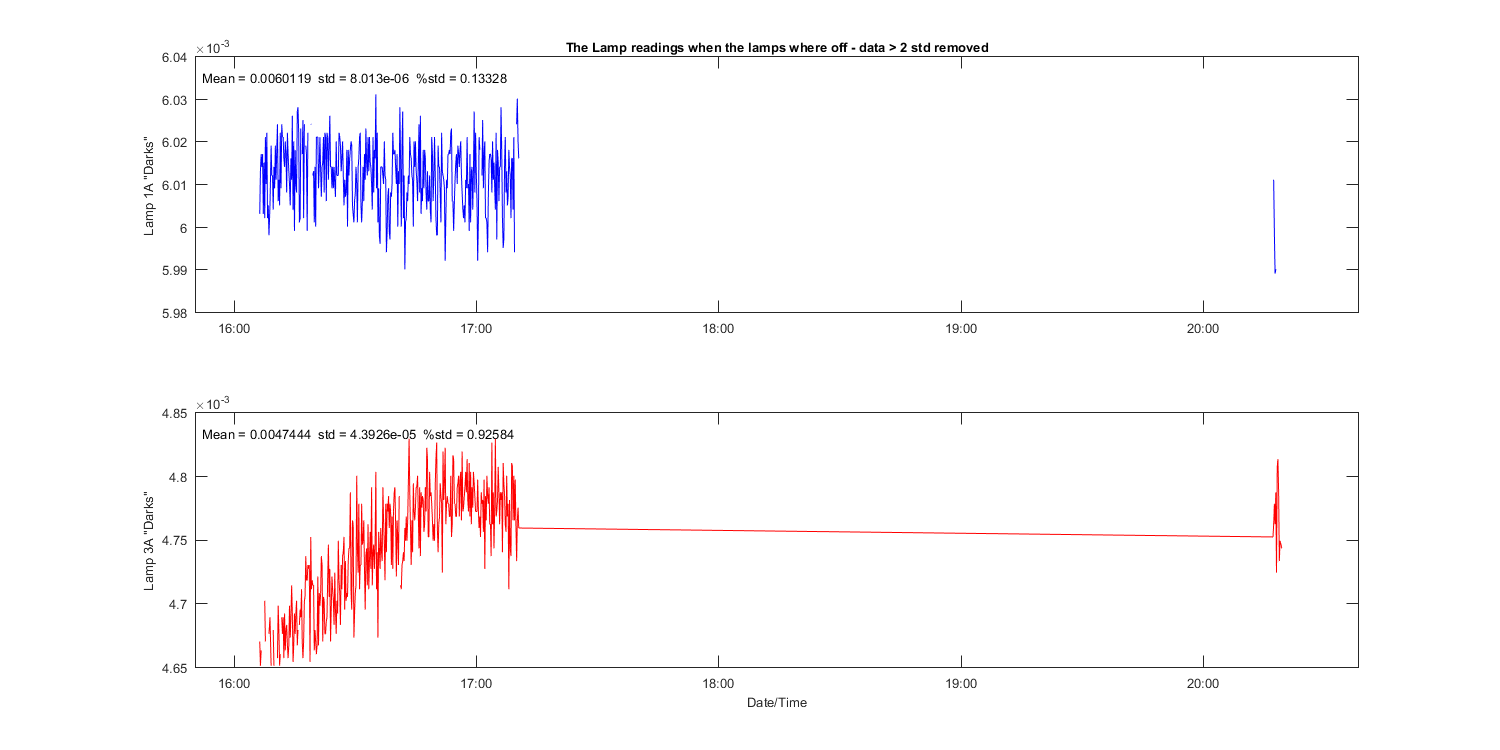
Figure 10