| Description | Value or Code |
|---|---|
| Cruise_Name:, Vaux(12,:) | NIST |
| Cruise_Number | 2017-002 |
| Investigator:: Vaux(16,:) | Carol Johnson |
| Location_of_Measurement: Vaux(17,:) | NIST B019_221 |
| Purpose: Vaux(18,:) | Stability Measurement |
| MOBY_NET_Sequence_Position: Vaux(20,:) | Calibration Facility |
| Ambient_Air_Temp (deg C) | 22.5 |
| Relative_Humidity (%) | 51.4 |
| #_of_Levels | 3 |
| Time_Step (sec) | 10 |
| Initial lamp state: Vaux(40,:) | All Off |
| Time_adjustment_to_GMT | 0 |
| Time_of_Last_Servicing | 20151218 |
| SQM_120VAC_On | 20170914.173600 |
| SQM_Off_to_Standby | 20170914.173948 |
| SQM_Standby_to_Off | 20170914.202930 |
| SQM_120VAC_Off | 20170914.203030 |
| Lamp 1 A burn hours | 0.6775 |
| Lamp 3 A burn hours | 1.6178 |
| DAQ_Program_Version | 0 |
| File Format Version | 2 |
| DAQ_Computer: Vaux(60,:) | EOS EQUIP 13 |
| DAQ_Program_Name: Vaux(61,:) | SQM Monitor_2.0.vi |
|
All Devices Under Test in the DUT column in DATA: DUT_White_Fiducial DUT_Net_CAS_Lu DUT_VXR |
|
ASCII SQM file data: SQM_20170914_001.txt
ASCII SQM file data: PDF log file
| Lamp | On/Off # | N | Time on (hrs) | Mean (meas./set) | std | %std |
|---|---|---|---|---|---|---|
| Lamp 1A | 1 | 217 | 0.63083 | 0.95 / 0.95 | 0.00012172 | 0.012813 |
| Lamp 3A | 1 | 514 | 1.4981 | 3.0001 / 3 | 0.0011608 | 0.038694 |
| Level | PD internal monitor (V) | Level Change # | Mean | std | %std |
|---|---|---|---|---|---|
| Medium (3A) | Red | 1 | 1.3275 | 0.0077771 | 0.58585 |
| Medium (3A) | White | 1 | 1.4625 | 0.009908 | 0.53176 |
| Medium (3A) | Blue | 1 | 1.4219 | 0.0072342 | 0.54695 |
| High (1A & 3A) | Red | 2 | 0.20844 | 0.00057592 | 0.2763 |
| High (1A & 3A) | White | 2 | 0.2066 | 0.0003065 | 0.27876 |
| High (1A & 3A) | Blue | 2 | 0.19567 | 0.00046067 | 0.29433 |
| Low (1A) | Red | 3 | 0.22637 | 0.059357 | 26.2217 |
| Low (1A) | White | 3 | 0.21902 | 0.054264 | 27.1008 |
| Low (1A) | Blue | 3 | 0.19706 | 0.031139 | 30.1212 |
| Level | Temperature (C) | Level Change # | Mean | std | %std |
|---|---|---|---|---|---|
| Medium (3A) | PD | 1 | 35.0082 | 0.1143 | 0.32649 |
| High (1A & 3A) | PD | 2 | 34.8761 | 0.071894 | 0.20614 |
| Low (1A) | PD | 3 | 35.0216 | 0.10326 | 0.29485 |
Red PD (max value): 1.3905: #of possible satureated values 0
White PD (max value): 1.5177: #of possible satureated values 0
Blue PD (max value): 1.4453: #of possible satureated values 0
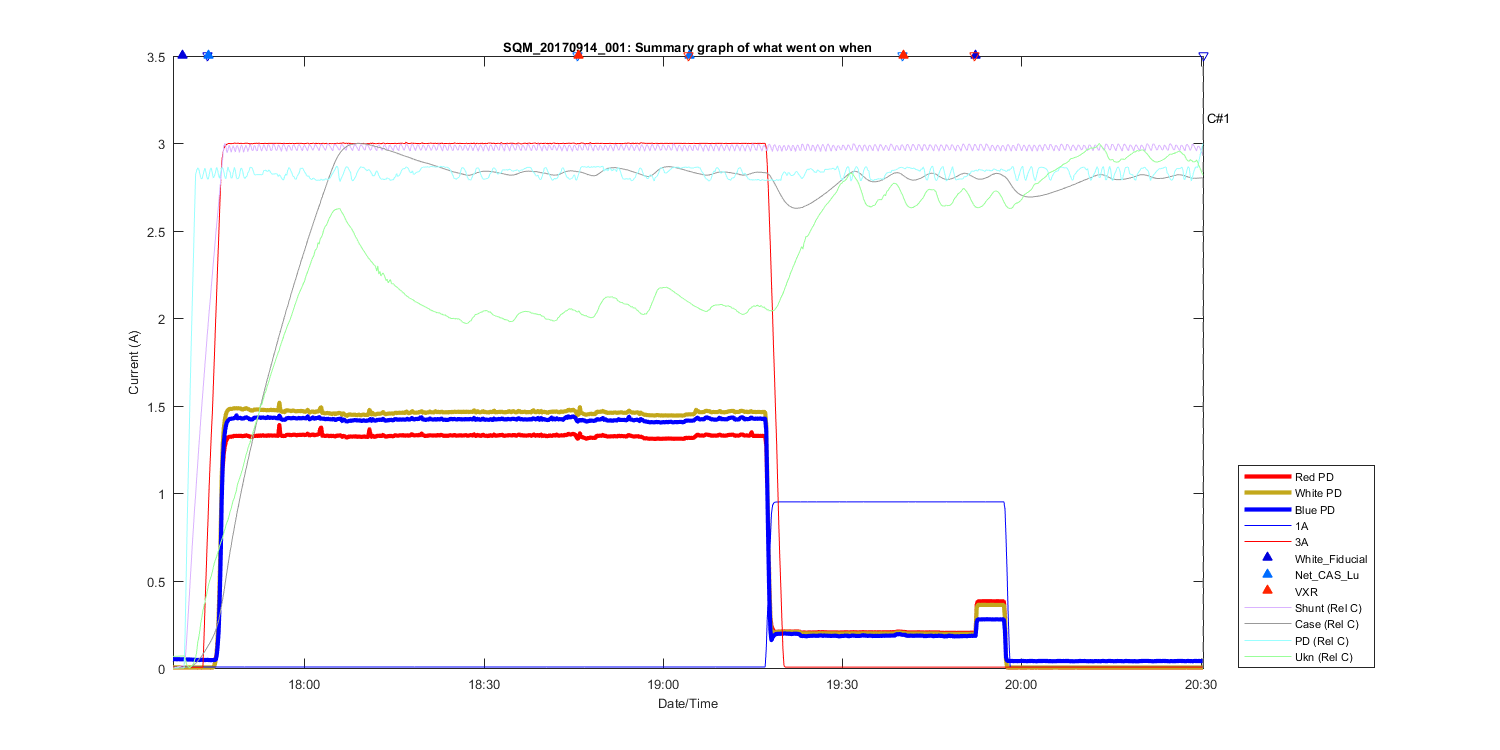
Figure 1
Summary Graph showing all measurements taken in this file, including auxilliary temperature measurements and comments. The text C# shows what time in the file the comments (shown above where made). The triangles at the top of the figure shows then a DUT (Device under test) was placed in front of the SQM and removed.
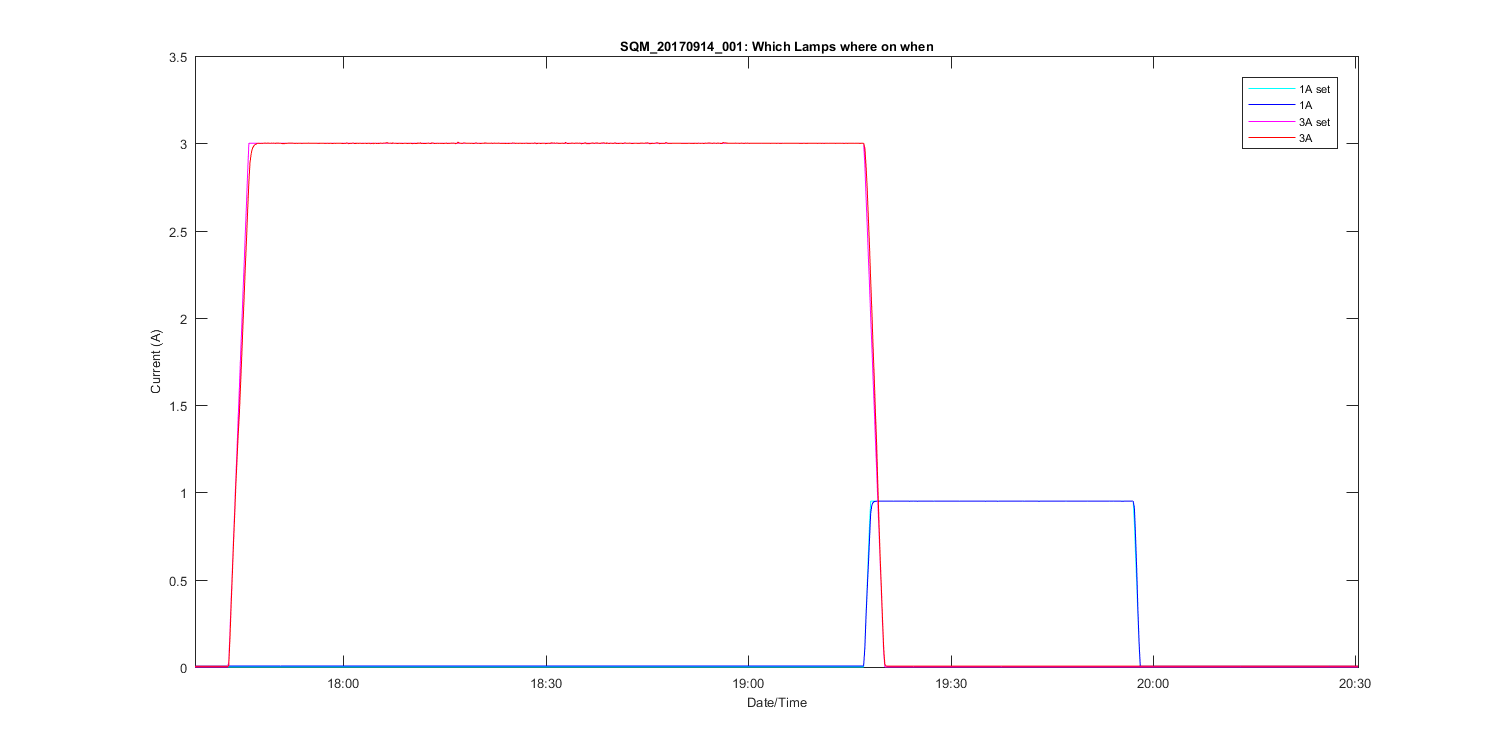
Figure 2
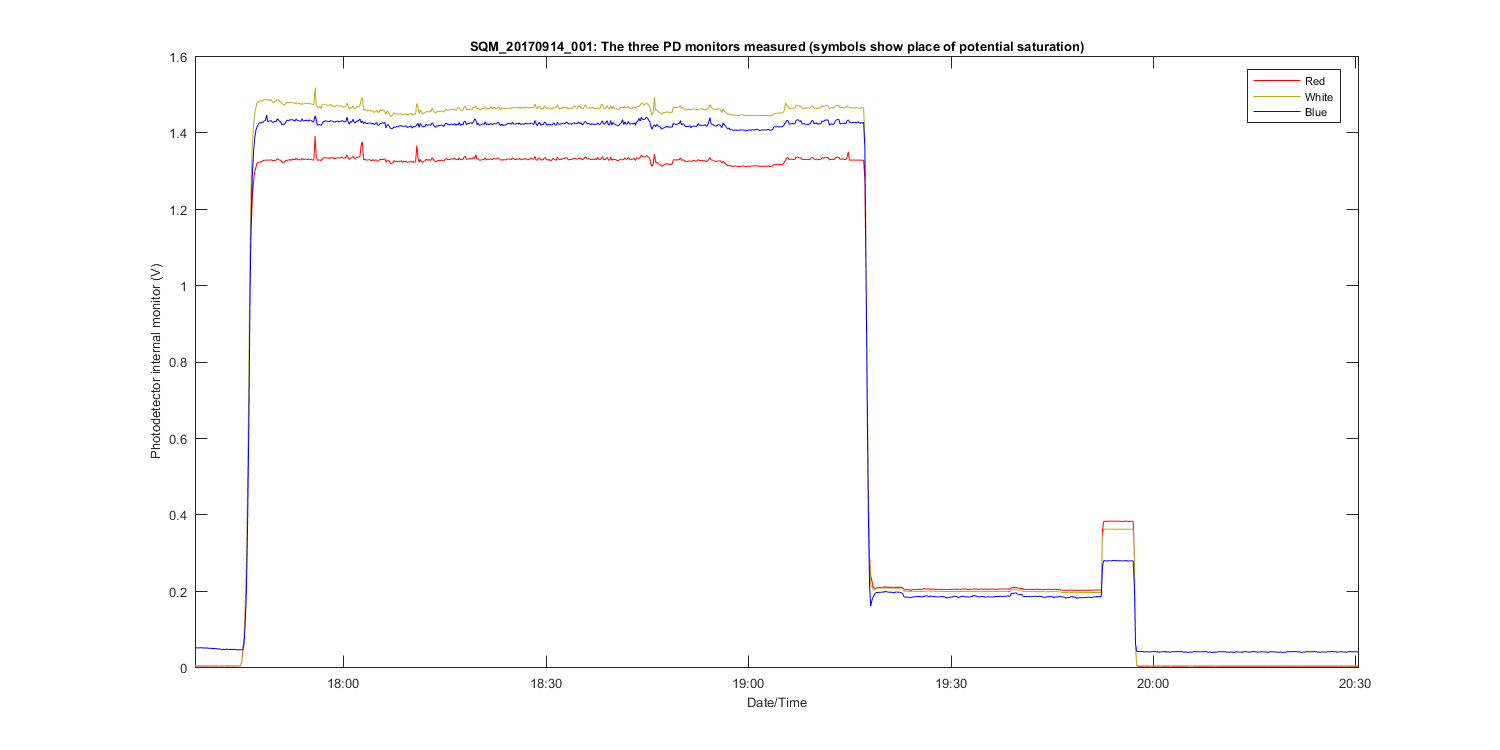
Figure 3
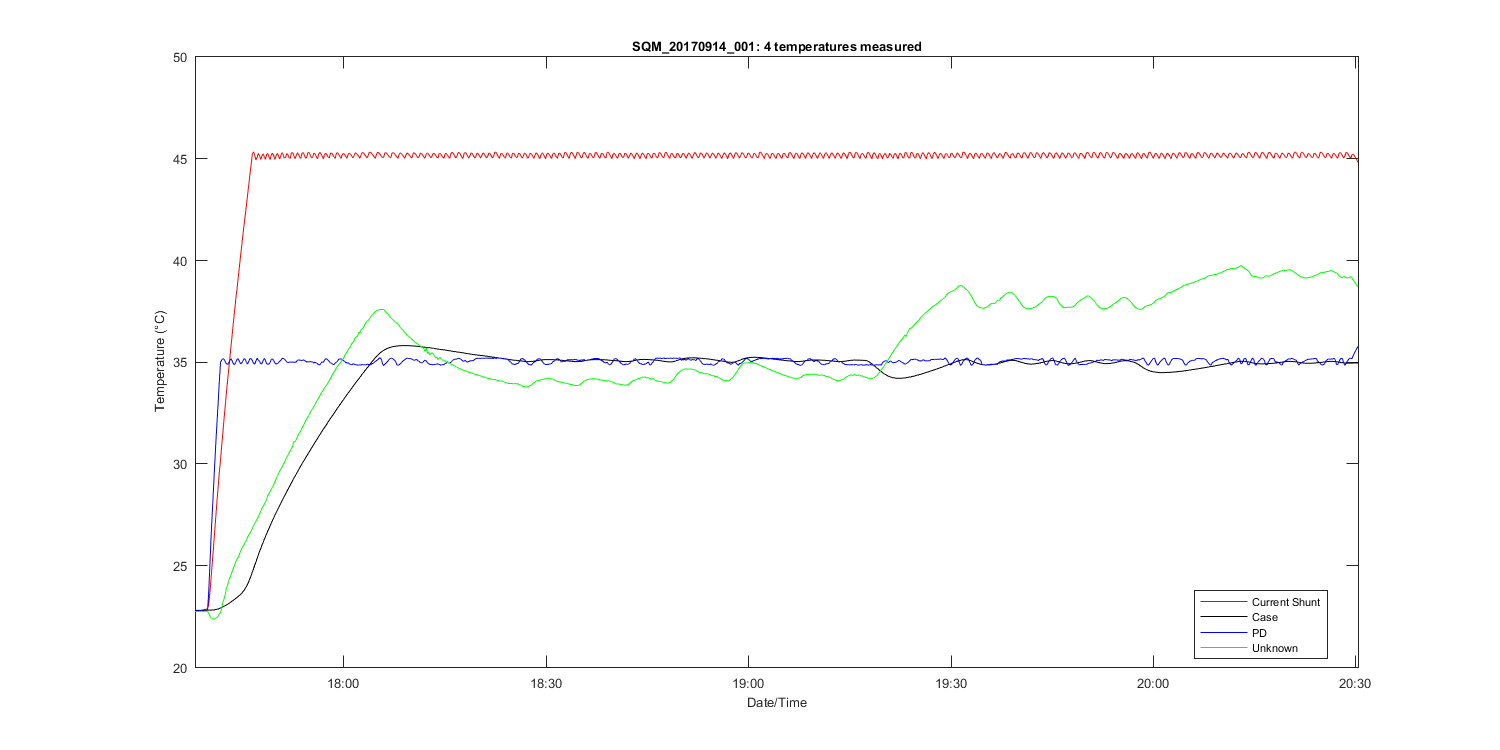
Figure 4
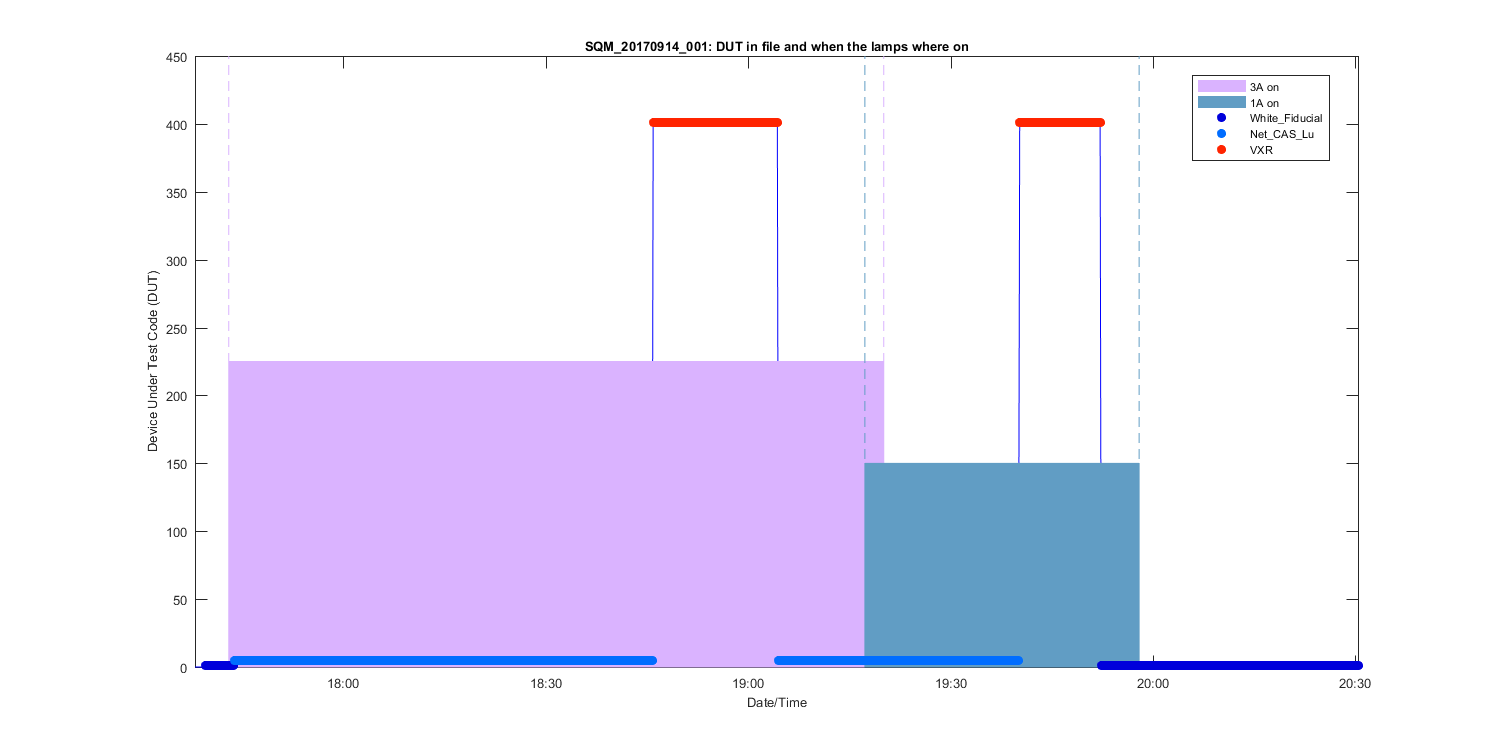
Figure 5
Figure 6
Figure 7
Figure 8
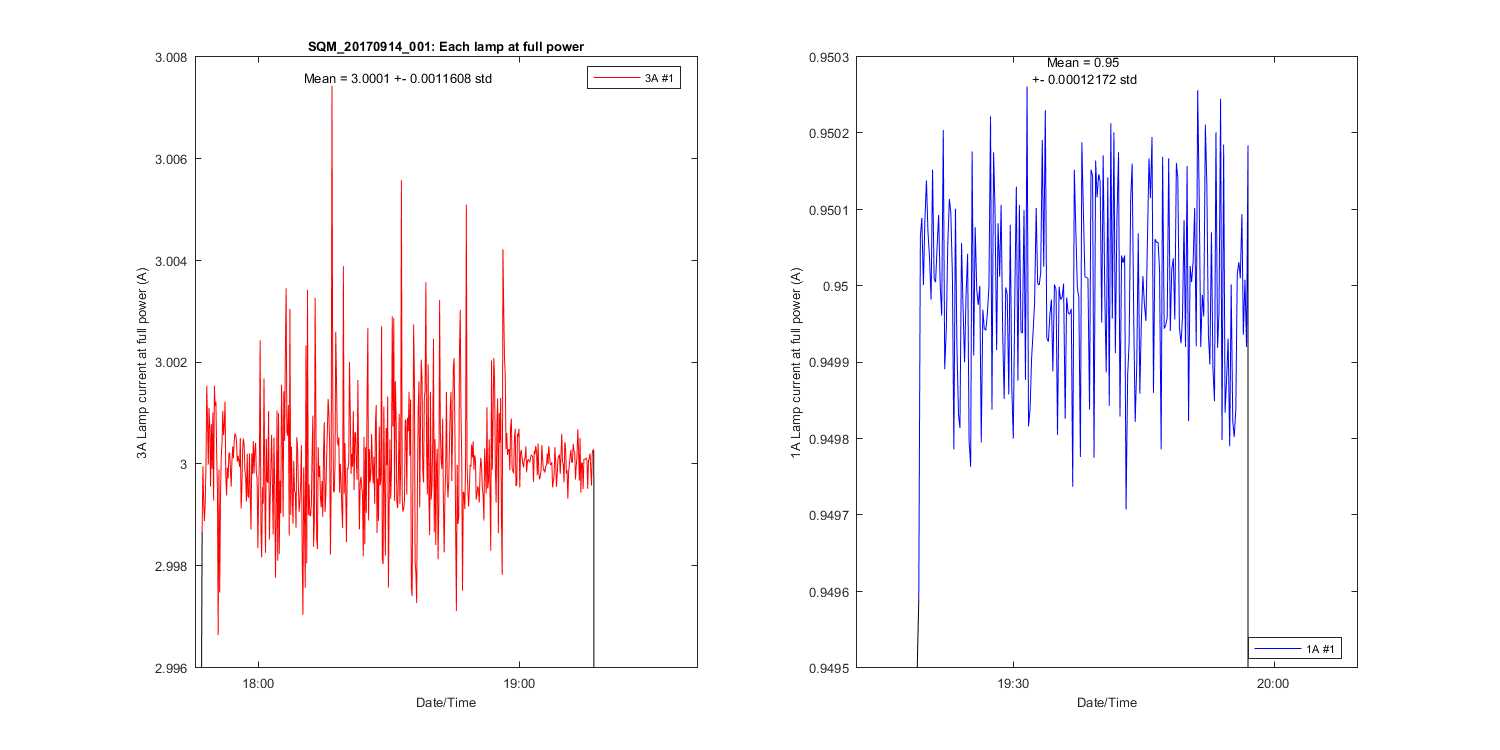
Figure 9
Figure 10