| Description | Value or Code |
|---|---|
| Cruise_Name:, Vaux(12,:) | NIST |
| Cruise_Number | 2017-002 |
| Investigator:: Vaux(16,:) | Carol Johnson |
| Location_of_Measurement: Vaux(17,:) | NIST B019_221 |
| Purpose: Vaux(18,:) | Stability Measurement |
| MOBY_NET_Sequence_Position: Vaux(20,:) | Calibration Facility |
| Ambient_Air_Temp (deg C) | 22.7 |
| Relative_Humidity (%) | 51.6 |
| #_of_Levels | 4 |
| Time_Step (sec) | 10 |
| Initial lamp state: Vaux(40,:) | All Off |
| Time_adjustment_to_GMT | 0 |
| Time_of_Last_Servicing | 20151218 |
| SQM_120VAC_On | 20170925.162000 |
| SQM_Off_to_Standby | 20170925.164315 |
| SQM_Standby_to_Off | 20170925.205122 |
| SQM_120VAC_Off | 20170925.205300 |
| Lamp 1 A burn hours | 2.3014 |
| Lamp 3 A burn hours | 1.8922 |
| DAQ_Program_Version | 0 |
| File Format Version | 2 |
| DAQ_Computer: Vaux(60,:) | EOS EQUIP 13 |
| DAQ_Program_Name: Vaux(61,:) | SQM Monitor_2.0.vi |
|
All Devices Under Test in the DUT column in DATA: DUT_White_Fiducial DUT_Net_CAS_Lu DUT_VXR DUT_SEI |
|
ASCII SQM file data: SQM_20170925_001.txt
ASCII SQM file data: PDF log file
| Lamp | On/Off # | N | Time on (hrs) | Mean (meas./set) | std | %std |
|---|---|---|---|---|---|---|
| Lamp 1A | 1 | 340 | 0.98972 | 0.95 / 0.95 | 0.00012144 | 0.012783 |
| Lamp 1A | 2 | 417 | 1.2147 | 0.94999 / 0.95 | 0.00012278 | 0.012924 |
| Lamp 3A | 1 | 608 | 1.7725 | 3 / 3 | 0.00069955 | 0.023318 |
| Level | PD internal monitor (V) | Level Change # | Mean | std | %std |
|---|---|---|---|---|---|
| Low (1A) | Red | 1 | 0.25858 | 0.082748 | 32.0011 |
| Low (1A) | White | 1 | 0.24758 | 0.075708 | 33.4221 |
| Low (1A) | Blue | 1 | 0.21184 | 0.043169 | 39.0622 |
| Medium (3A) | Red | 3 | 1.3227 | 0.0088672 | 0.67039 |
| Medium (3A) | White | 3 | 1.4504 | 0.0078469 | 0.61137 |
| Medium (3A) | Blue | 3 | 1.413 | 0.0074474 | 0.62755 |
| High (1A & 3A) | Red | 4 | 1.5202 | 0.025557 | 1.6812 |
| High (1A & 3A) | White | 4 | 1.6511 | 0.025391 | 1.5478 |
| High (1A & 3A) | Blue | 4 | 1.5649 | 0.020572 | 1.6331 |
| Level | Temperature (C) | Level Change # | Mean | std | %std |
|---|---|---|---|---|---|
| Low (1A) | PD | 1 | 35.0235 | 0.11562 | 0.33011 |
| Medium (3A) | PD | 3 | 34.9803 | 0.11667 | 0.33354 |
| High (1A & 3A) | PD | 4 | 34.9635 | 0.11289 | 0.32288 |
Red PD (max value): 1.5571: #of possible satureated values 0
White PD (max value): 1.6888: #of possible satureated values 0
Blue PD (max value): 1.5964: #of possible satureated values 0
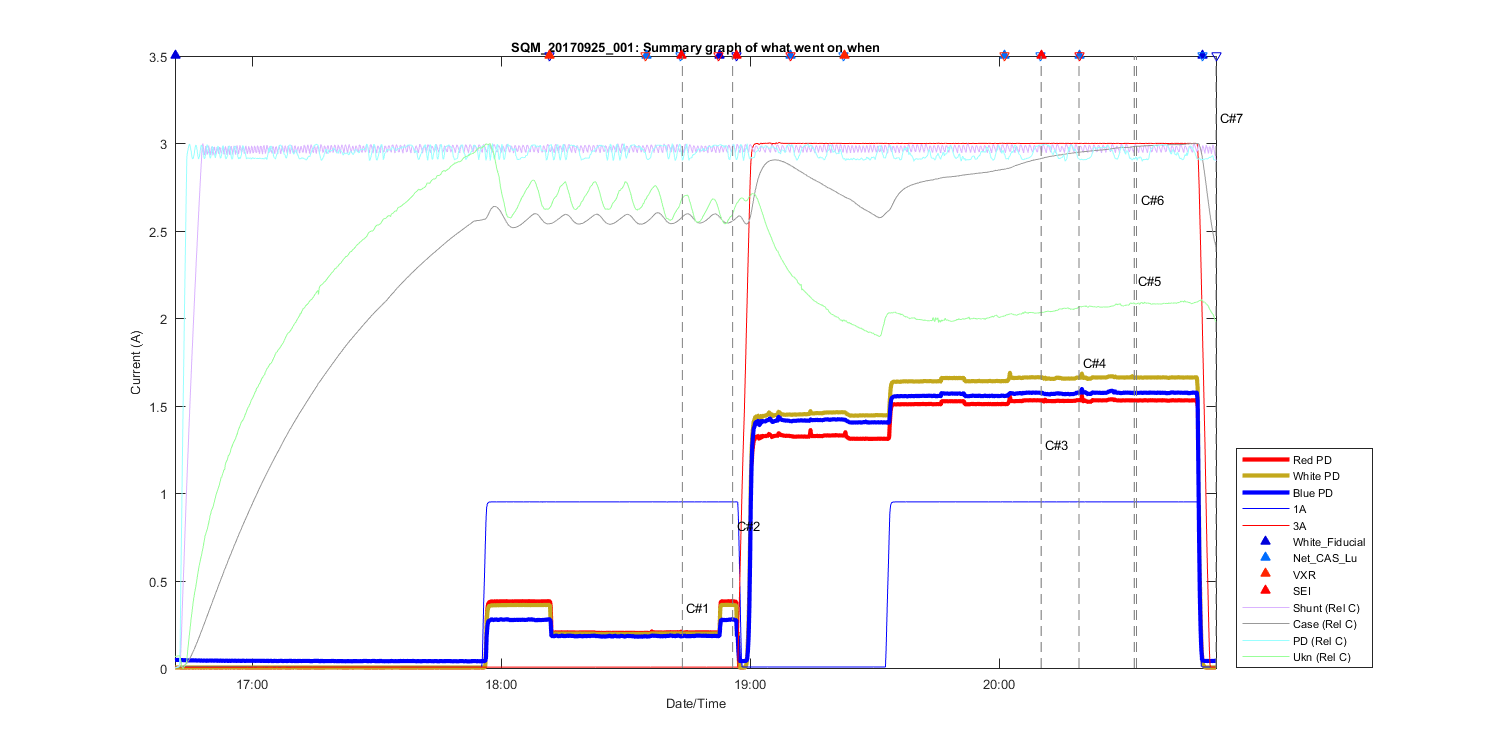
Figure 1
Summary Graph showing all measurements taken in this file, including auxilliary temperature measurements and comments. The text C# shows what time in the file the comments (shown above where made). The triangles at the top of the figure shows then a DUT (Device under test) was placed in front of the SQM and removed.
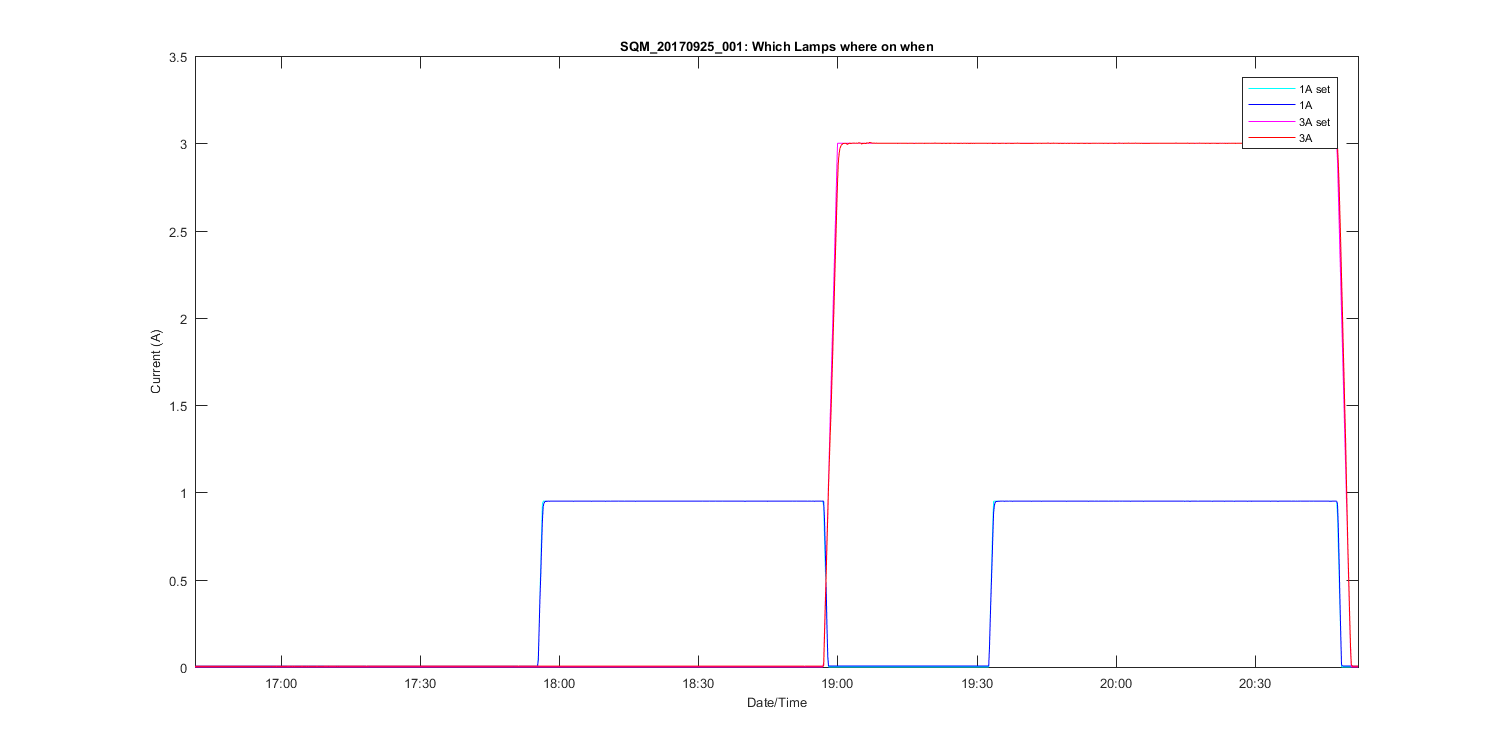
Figure 2
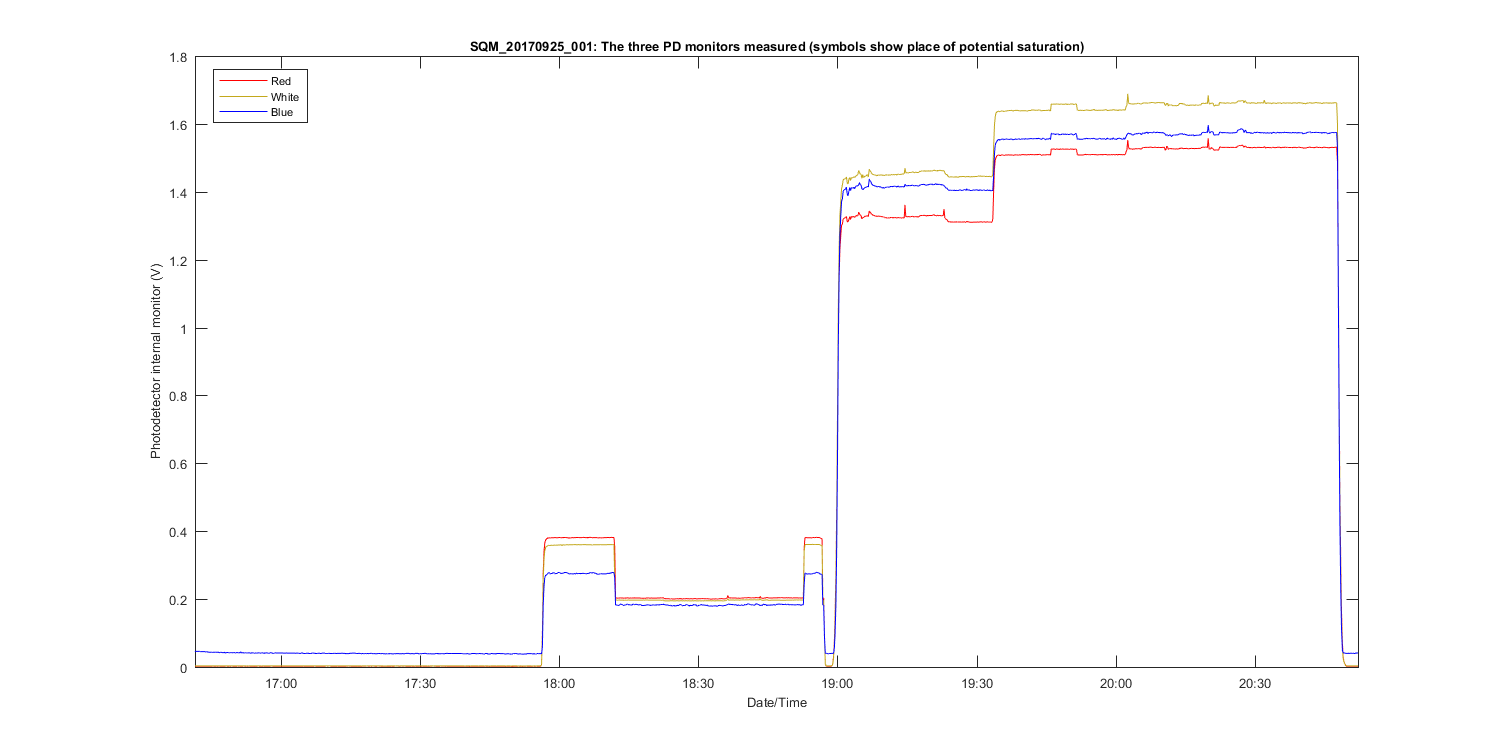
Figure 3
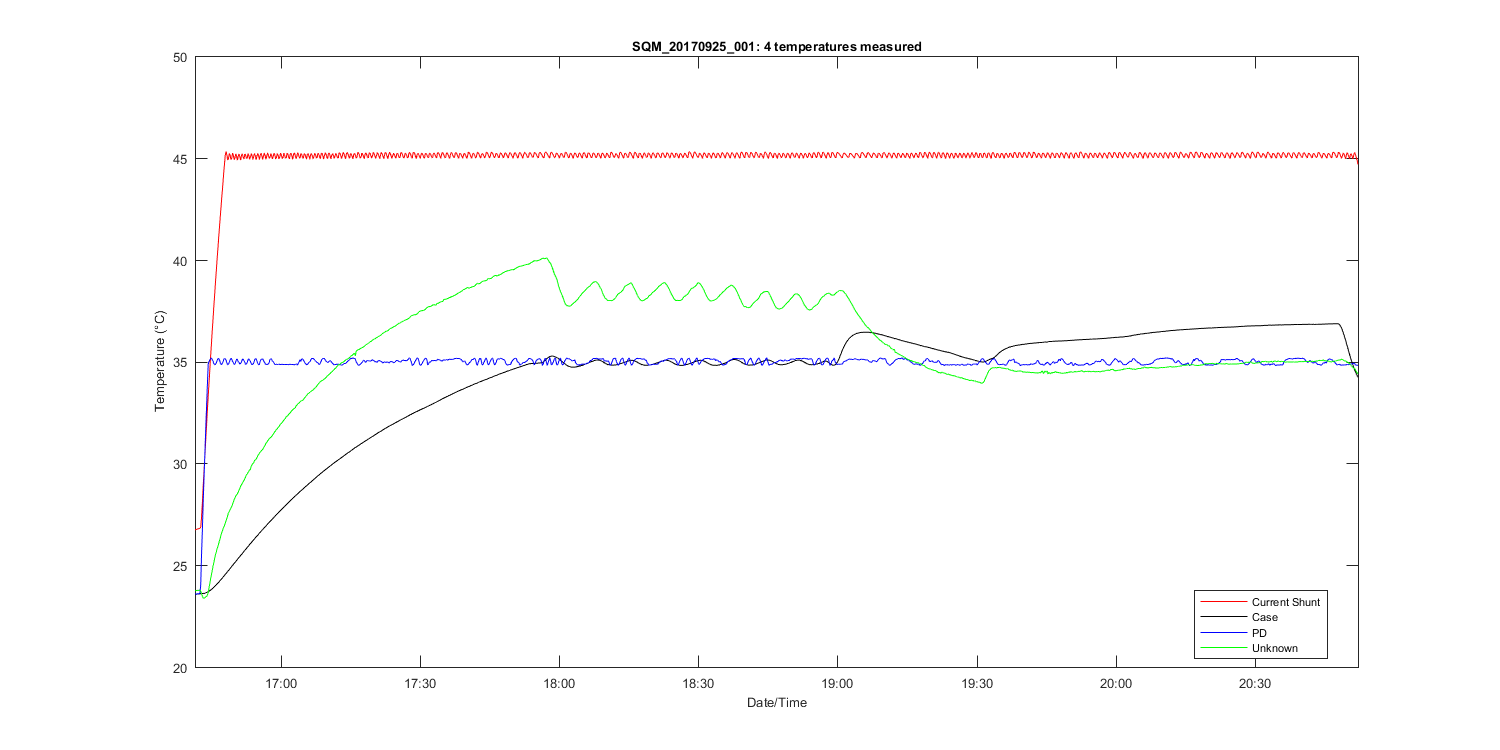
Figure 4
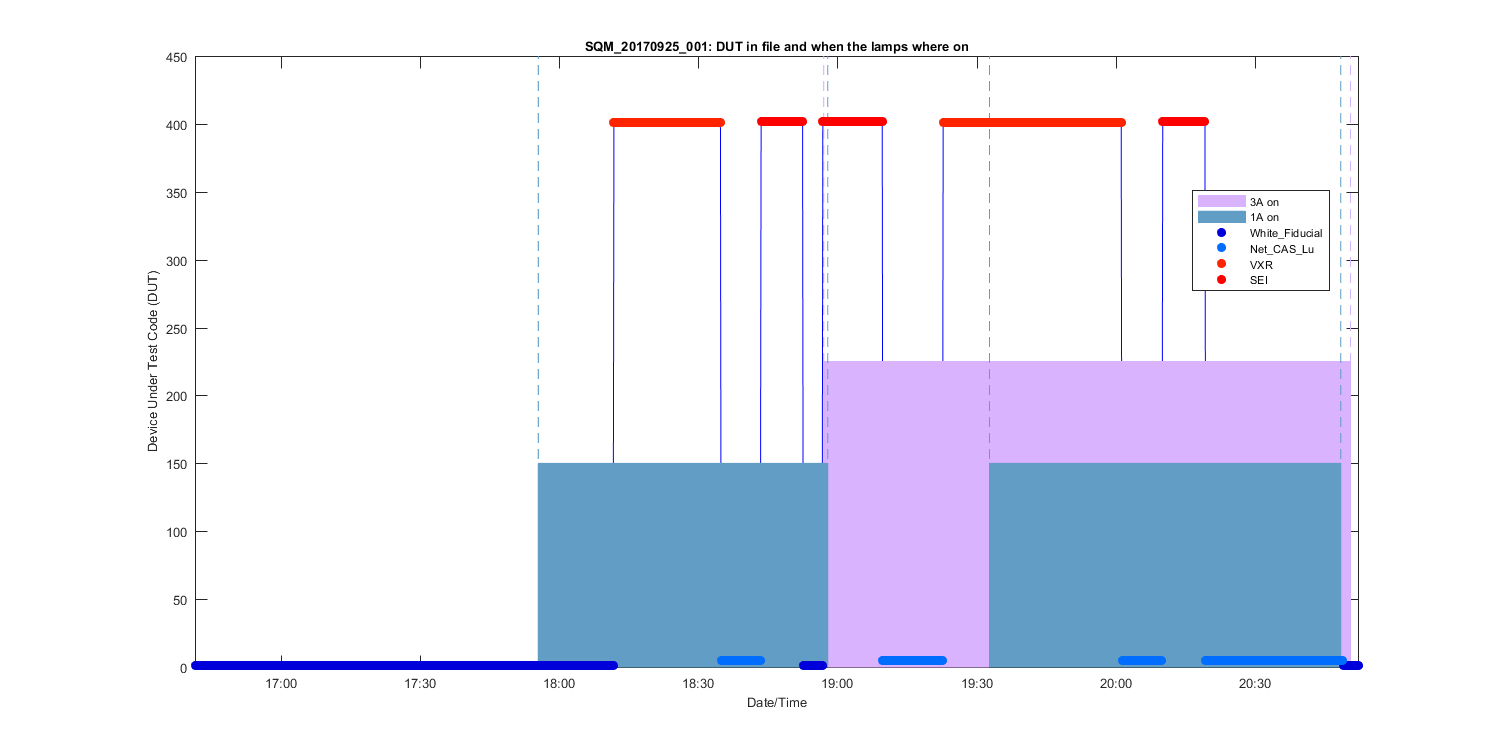
Figure 5
Figure 6
Figure 7
Figure 8
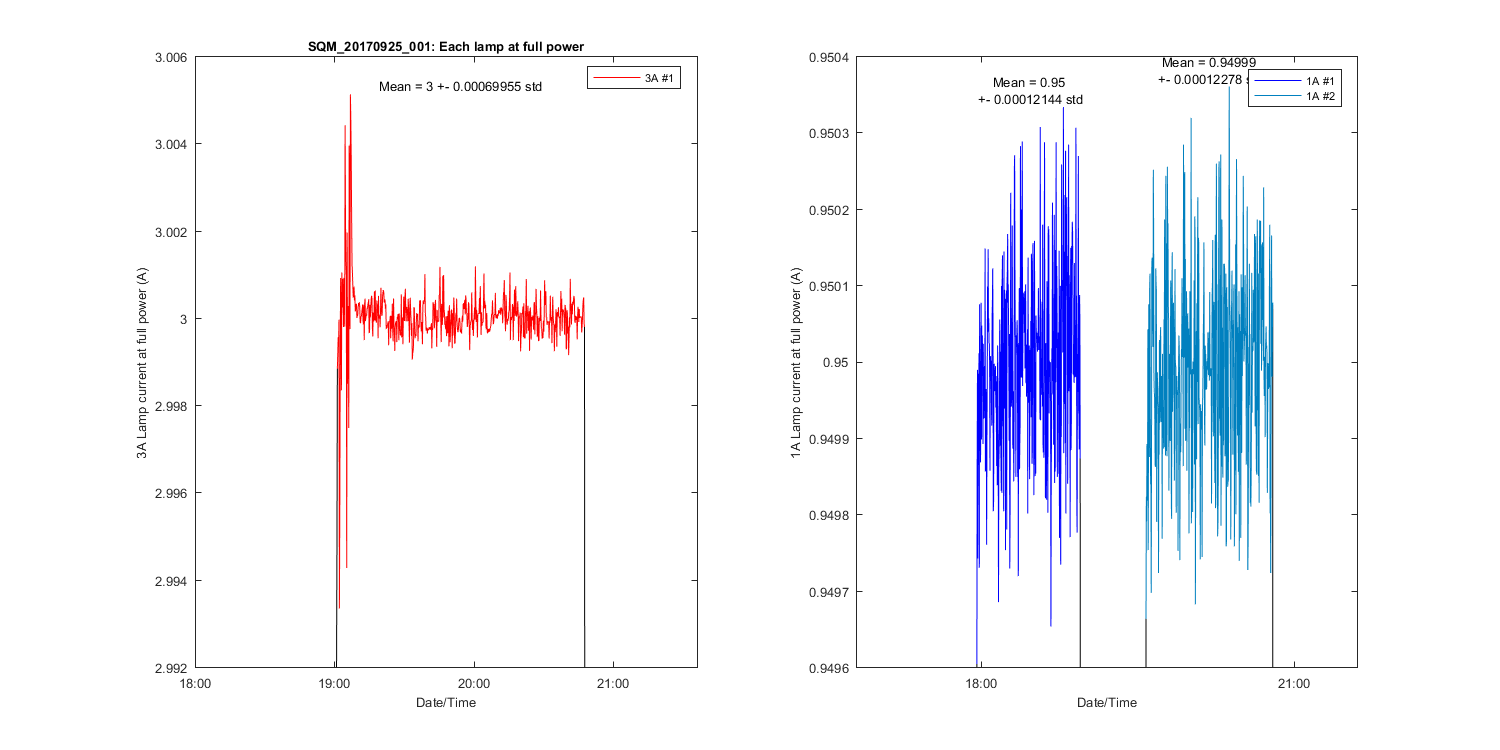
Figure 9
Figure 10