| Description | Value or Code |
|---|---|
| Cruise_Name:, Vaux(12,:) | NIST |
| Cruise_Number | 2017-002 |
| Investigator:: Vaux(16,:) | Carol Johnson |
| Location_of_Measurement: Vaux(17,:) | NIST B019_221 |
| Purpose: Vaux(18,:) | Stability Measurement |
| MOBY_NET_Sequence_Position: Vaux(20,:) | Calibration Facility |
| Ambient_Air_Temp (deg C) | 22.5 |
| Relative_Humidity (%) | 51.7 |
| #_of_Levels | 4 |
| Time_Step (sec) | 10 |
| Initial lamp state: Vaux(40,:) | All Off |
| Time_adjustment_to_GMT | 0 |
| Time_of_Last_Servicing | 20151218 |
| SQM_120VAC_On | 20171006.153500 |
| SQM_Off_to_Standby | 20171006.161453 |
| SQM_Standby_to_Off | 20171006.203015 |
| SQM_120VAC_Off | 20171006.203100 |
| Lamp 1 A burn hours | 2.8411 |
| Lamp 3 A burn hours | 2.9872 |
| DAQ_Program_Version | 13 |
| File Format Version | 2 |
| DAQ_Computer: Vaux(60,:) | EOS EQUIP 13 |
| DAQ_Program_Name: Vaux(61,:) | SQM Monitor_2.1.vi |
|
All Devices Under Test in the DUT column in DATA: DUT_White_Fiducial DUT_Net_CAS_Lu DUT_VXR DUT_SEI |
|
ASCII SQM file data: SQM_20171006_001.txt
ASCII SQM file data: PDF log file
| Lamp | On/Off # | N | Time on (hrs) | Mean (meas./set) | std | %std |
|---|---|---|---|---|---|---|
| Lamp 1A | 1 | 383 | 1.1156 | 0.94998 / 0.95 | 0.00011126 | 0.011711 |
| Lamp 1A | 2 | 559 | 1.6292 | 0.94999 / 0.95 | 0.0001098 | 0.011558 |
| Lamp 3A | 1 | 983 | 2.8672 | 3 / 3 | 0.0011694 | 0.03898 |
| Level | PD internal monitor (V) | Level Change # | Mean | std | %std |
|---|---|---|---|---|---|
| Low (1A) | Red | 1 | 0.24023 | 0.072085 | 30.0067 |
| Low (1A) | White | 1 | 0.23354 | 0.0687 | 30.8665 |
| Low (1A) | Blue | 1 | 0.20436 | 0.036988 | 35.2736 |
| Medium (3A) | Red | 3 | 1.3204 | 0.013965 | 1.0577 |
| Medium (3A) | White | 3 | 1.454 | 0.012927 | 0.96051 |
| Medium (3A) | Blue | 3 | 1.415 | 0.01348 | 0.98694 |
| High (1A & 3A) | Red | 4 | 1.5192 | 0.024236 | 1.5953 |
| High (1A & 3A) | White | 4 | 1.6523 | 0.023616 | 1.4668 |
| High (1A & 3A) | Blue | 4 | 1.5667 | 0.019264 | 1.547 |
| Level | Temperature (C) | Level Change # | Mean | std | %std |
|---|---|---|---|---|---|
| Low (1A) | PD | 1 | 34.9839 | 0.11403 | 0.32595 |
| Medium (3A) | PD | 3 | 34.9294 | 0.10491 | 0.30036 |
| High (1A & 3A) | PD | 4 | 34.9796 | 0.11077 | 0.31666 |
Red PD (max value): 1.6011: #of possible satureated values 0
White PD (max value): 1.7126: #of possible satureated values 0
Blue PD (max value): 1.5874: #of possible satureated values 0
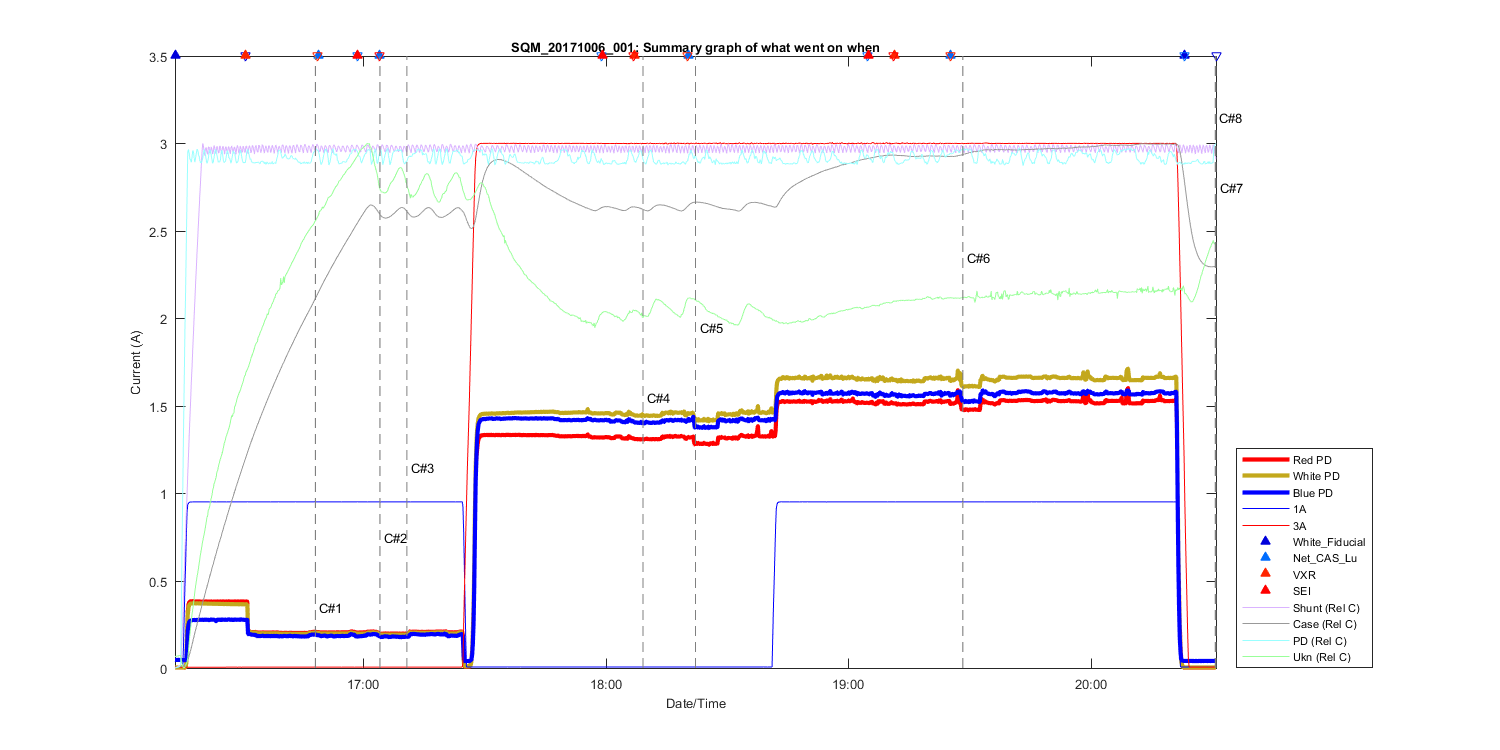
Figure 1
Summary Graph showing all measurements taken in this file, including auxilliary temperature measurements and comments. The text C# shows what time in the file the comments (shown above where made). The triangles at the top of the figure shows then a DUT (Device under test) was placed in front of the SQM and removed.
Figure 2
Figure 3
Figure 4
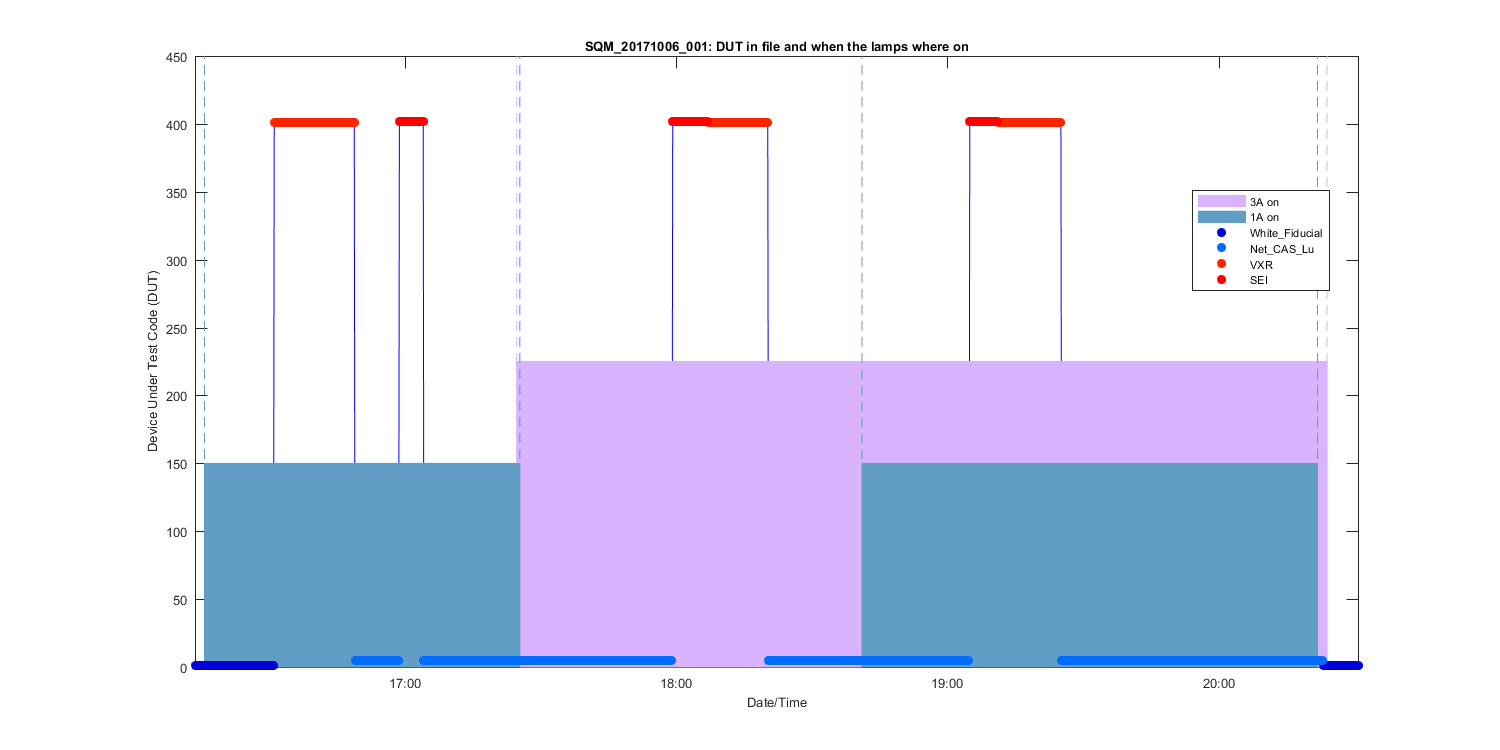
Figure 5
Figure 6
Figure 7
Figure 8
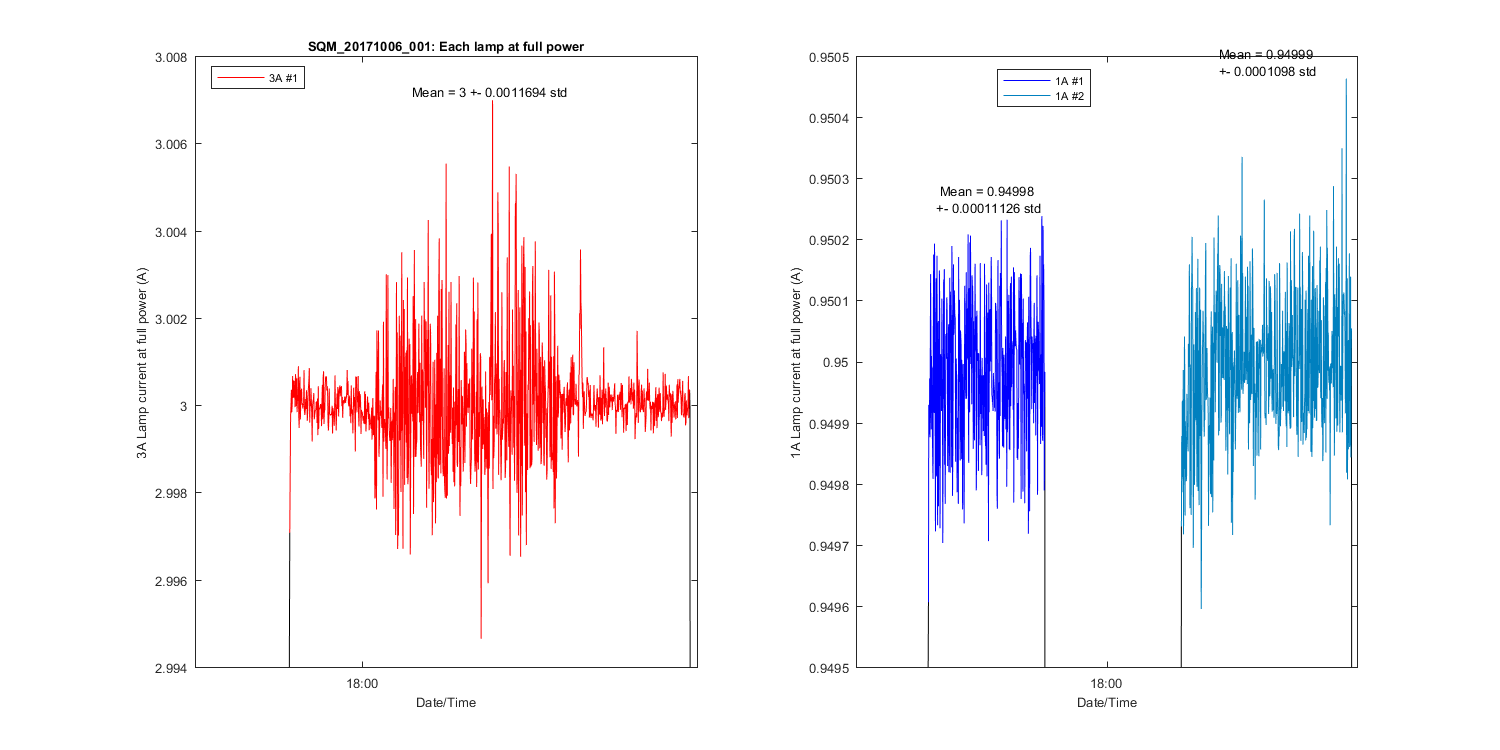
Figure 9
Figure 10