| Description | Value or Code |
|---|---|
| Cruise_Name:, Vaux(12,:) | NIST |
| Cruise_Number | 2017-002 |
| Investigator:: Vaux(16,:) | Carol Johnson |
| Location_of_Measurement: Vaux(17,:) | NIST B019_221 |
| Purpose: Vaux(18,:) | Stability Measurement |
| MOBY_NET_Sequence_Position: Vaux(20,:) | Calibration Facility |
| Ambient_Air_Temp (deg C) | 22.5 |
| Relative_Humidity (%) | 51 |
| #_of_Levels | 3 |
| Time_Step (sec) | 10 |
| Initial lamp state: Vaux(40,:) | All Off |
| Time_adjustment_to_GMT | 0 |
| Time_of_Last_Servicing | 20151218 |
| SQM_120VAC_On | 20171013.123000 |
| SQM_Off_to_Standby | 20171013.181108 |
| SQM_Standby_to_Off | 20171013.202738 |
| SQM_120VAC_Off | 20171013.203000 |
| Lamp 1 A burn hours | 0.75056 |
| Lamp 3 A burn hours | 0.70944 |
| DAQ_Program_Version | 13 |
| File Format Version | 2 |
| DAQ_Computer: Vaux(60,:) | EOS EQUIP 13 |
| DAQ_Program_Name: Vaux(61,:) | SQM Monitor_2.1.vi |
|
All Devices Under Test in the DUT column in DATA: DUT_White_Fiducial DUT_Net_CAS_Lu DUT_VXR DUT_SEI |
|
ASCII SQM file data: SQM_20171013_002.txt
ASCII SQM file data: PDF log file
| Lamp | On/Off # | N | Time on (hrs) | Mean (meas./set) | std | %std |
|---|---|---|---|---|---|---|
| Lamp 1A | 1 | 242 | 0.70361 | 0.94999 / 0.95 | 0.00011994 | 0.012625 |
| Lamp 3A | 1 | 203 | 0.59 | 3.0001 / 3 | 0.00030359 | 0.010119 |
| Level | PD internal monitor (V) | Level Change # | Mean | std | %std |
|---|---|---|---|---|---|
| Low (1A) | Red | 1 | 0.27439 | 0.088161 | 32.1297 |
| Low (1A) | White | 1 | 0.26264 | 0.08054 | 33.5667 |
| Low (1A) | Blue | 1 | 0.22147 | 0.045996 | 39.8066 |
| Medium (3A) | Red | 3 | 1.3126 | 0.012409 | 0.94542 |
| Medium (3A) | White | 3 | 1.4427 | 0.012441 | 0.86016 |
| Medium (3A) | Blue | 3 | 1.4069 | 0.012595 | 0.88204 |
| Level | Temperature (C) | Level Change # | Mean | std | %std |
|---|---|---|---|---|---|
| Low (1A) | PD | 1 | 35.0165 | 0.11286 | 0.32232 |
| Medium (3A) | PD | 3 | 34.9828 | 0.1247 | 0.35646 |
Red PD (max value): 1.3517: #of possible satureated values 0
White PD (max value): 1.5046: #of possible satureated values 0
Blue PD (max value): 1.4465: #of possible satureated values 0
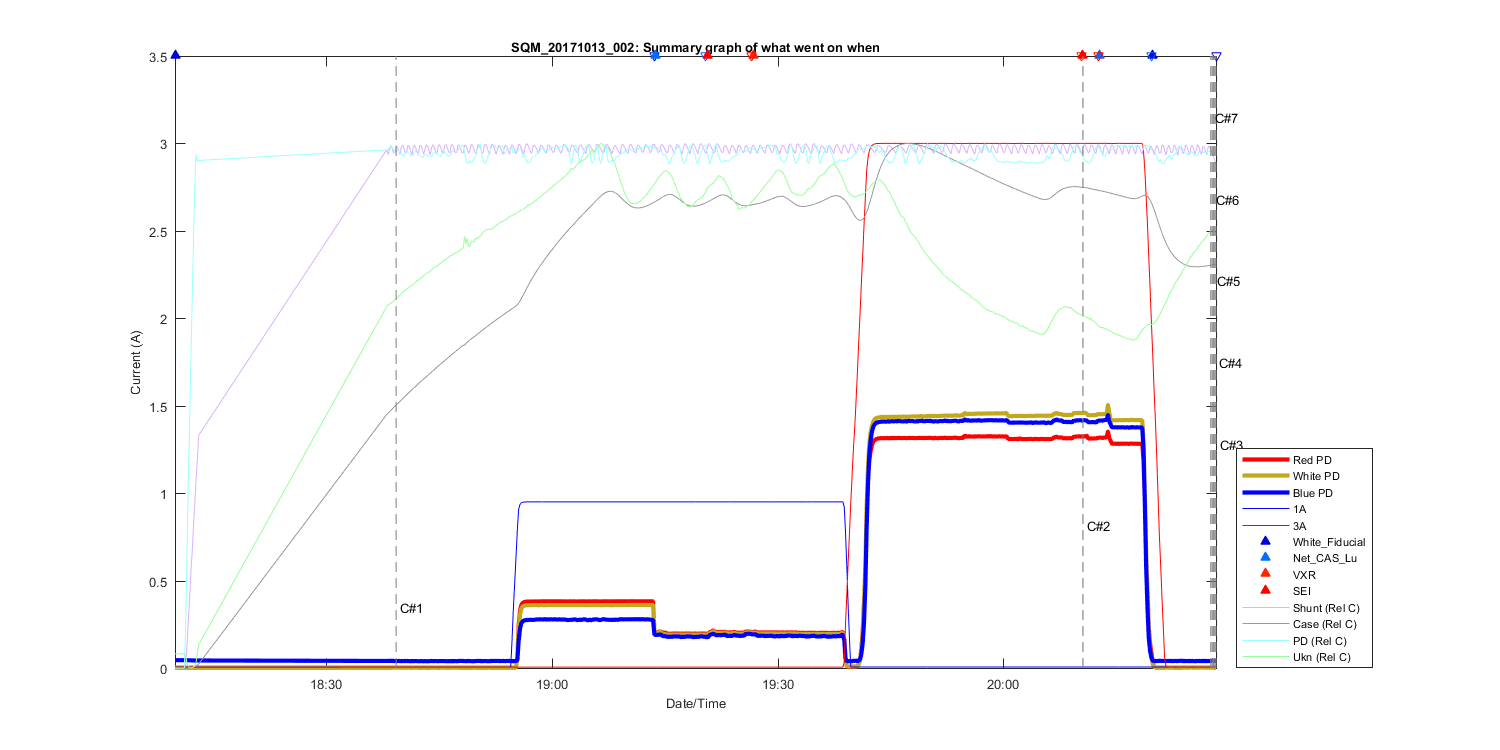
Figure 1
Summary Graph showing all measurements taken in this file, including auxilliary temperature measurements and comments. The text C# shows what time in the file the comments (shown above where made). The triangles at the top of the figure shows then a DUT (Device under test) was placed in front of the SQM and removed.
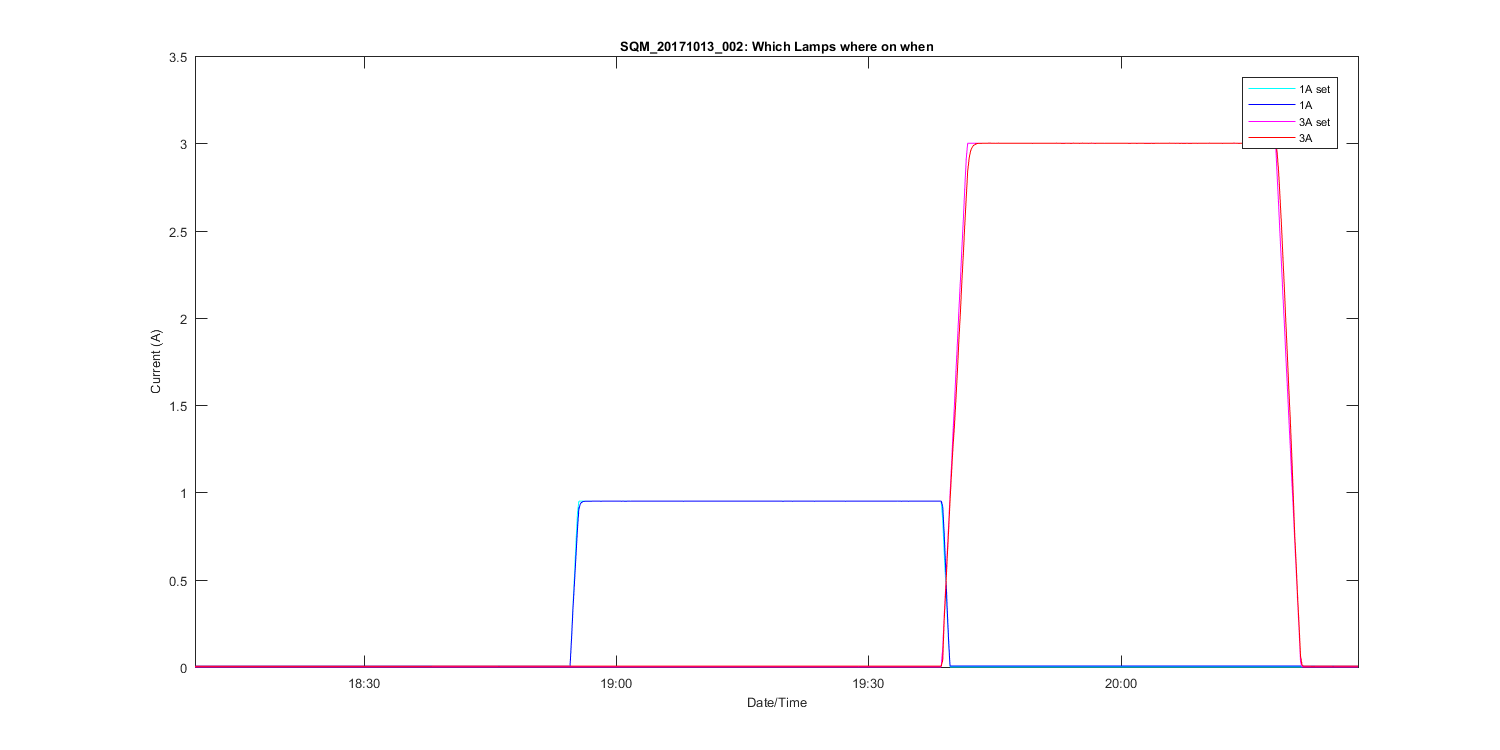
Figure 2
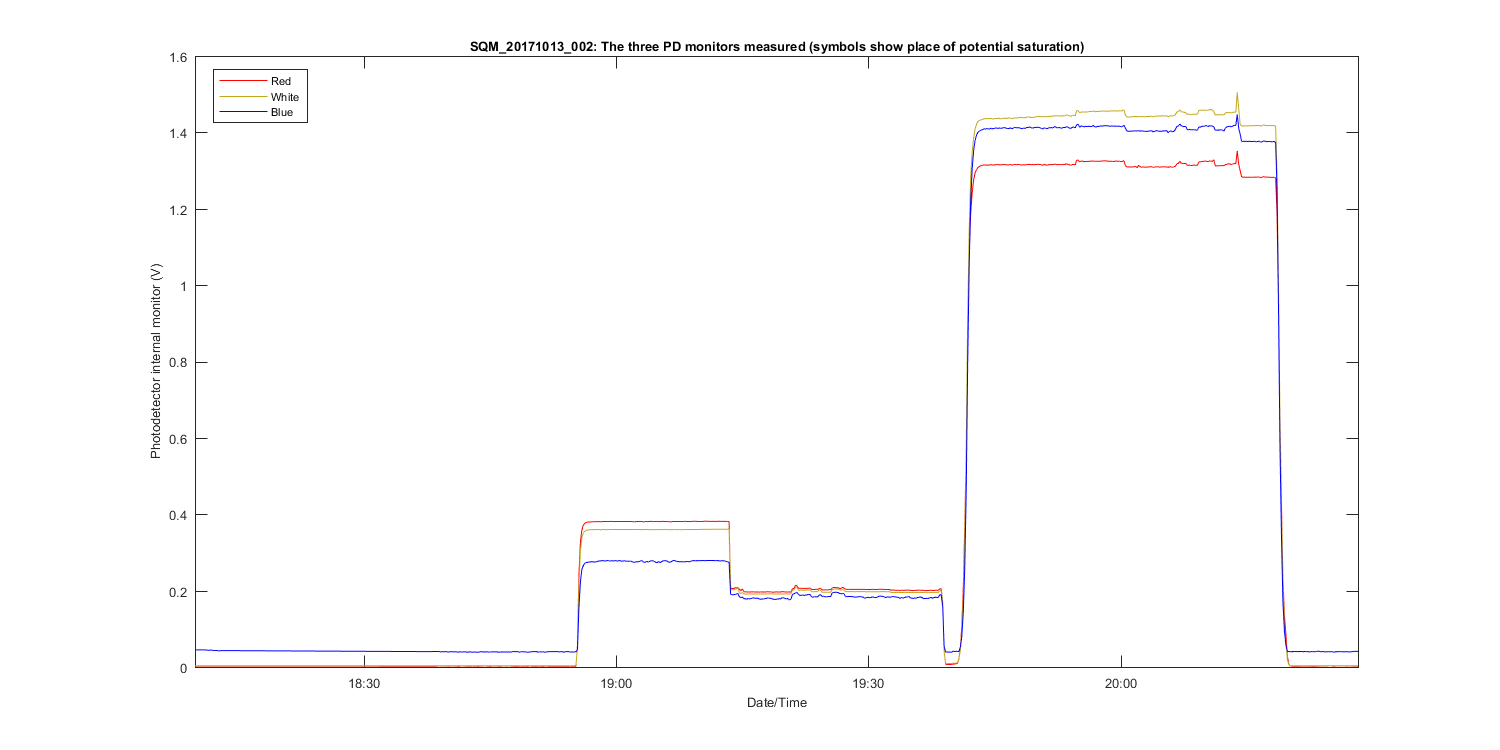
Figure 3
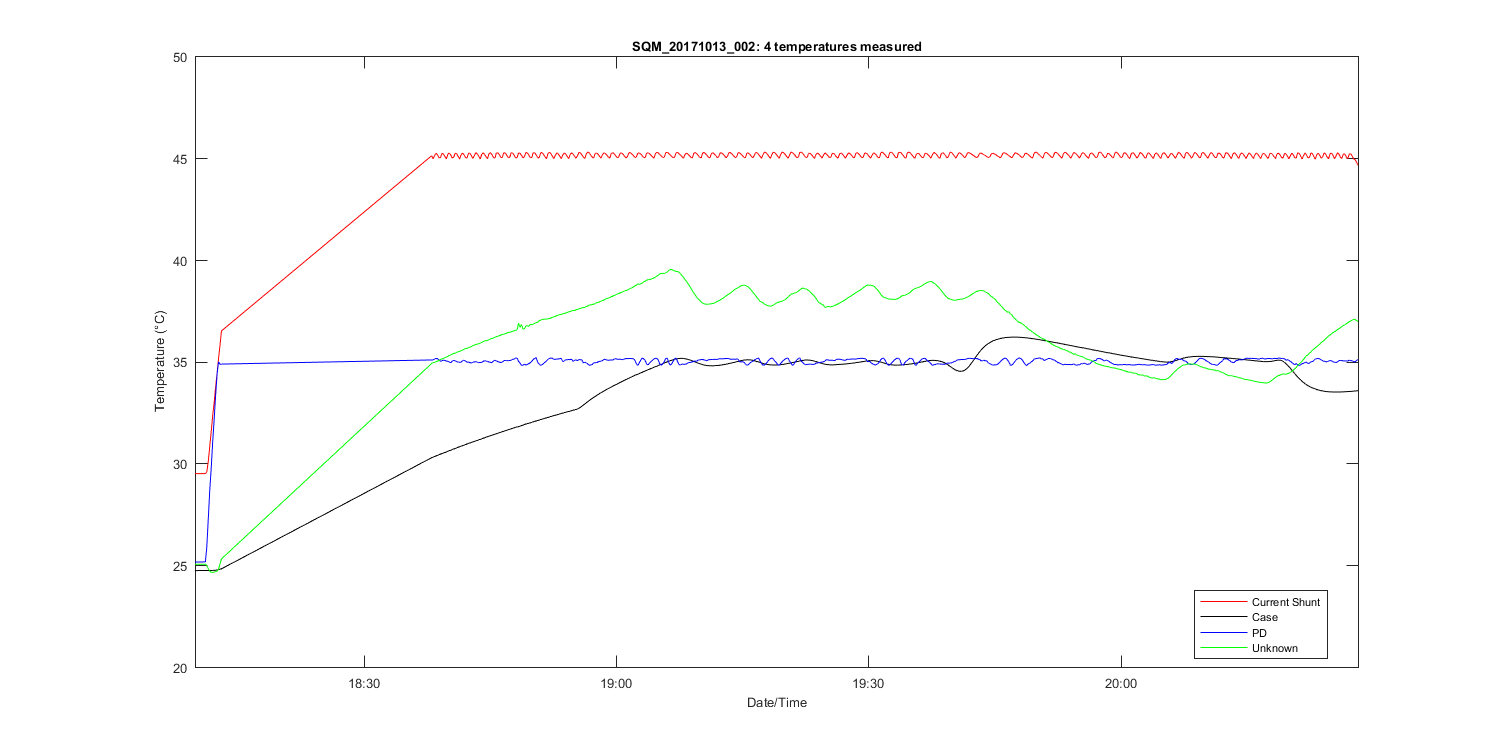
Figure 4
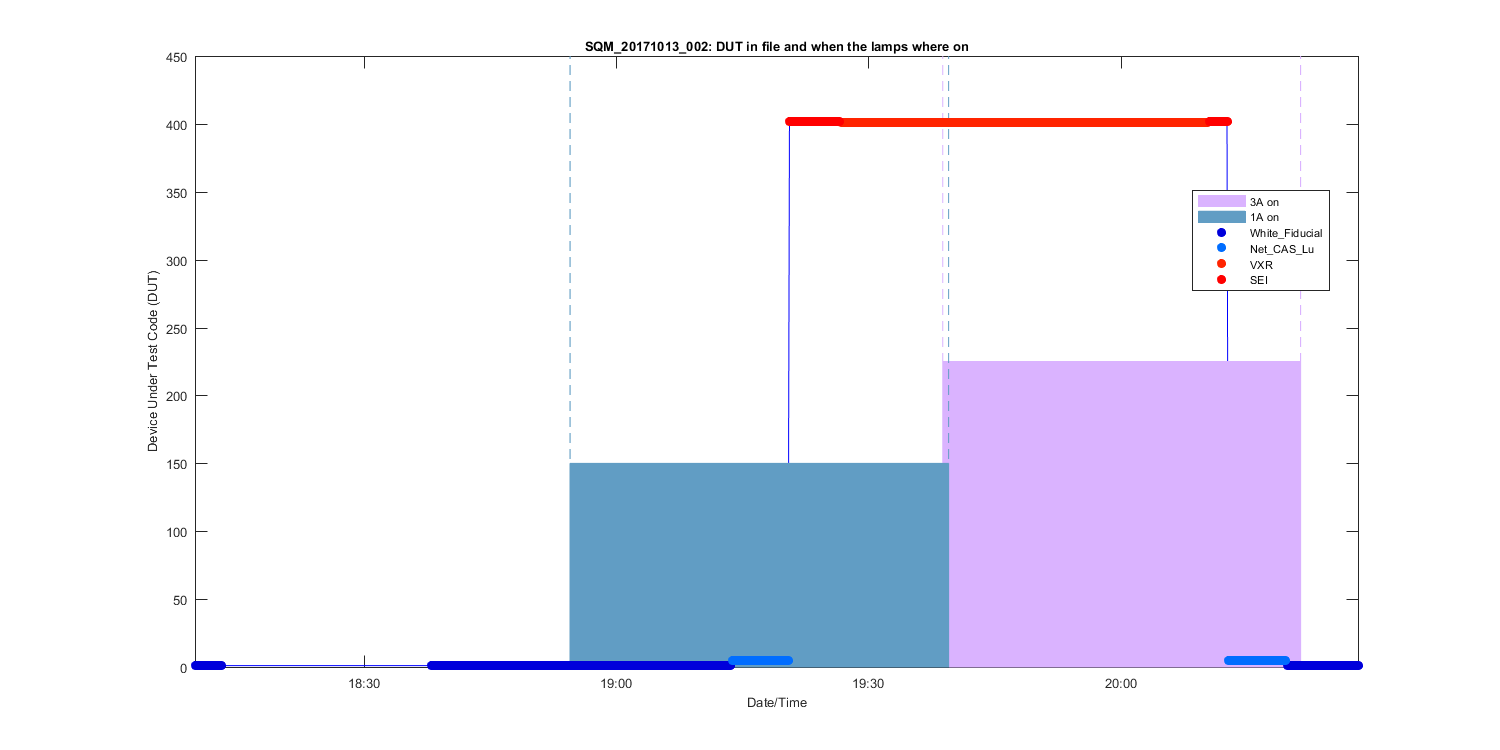
Figure 5
Figure 6
Figure 7
Figure 8
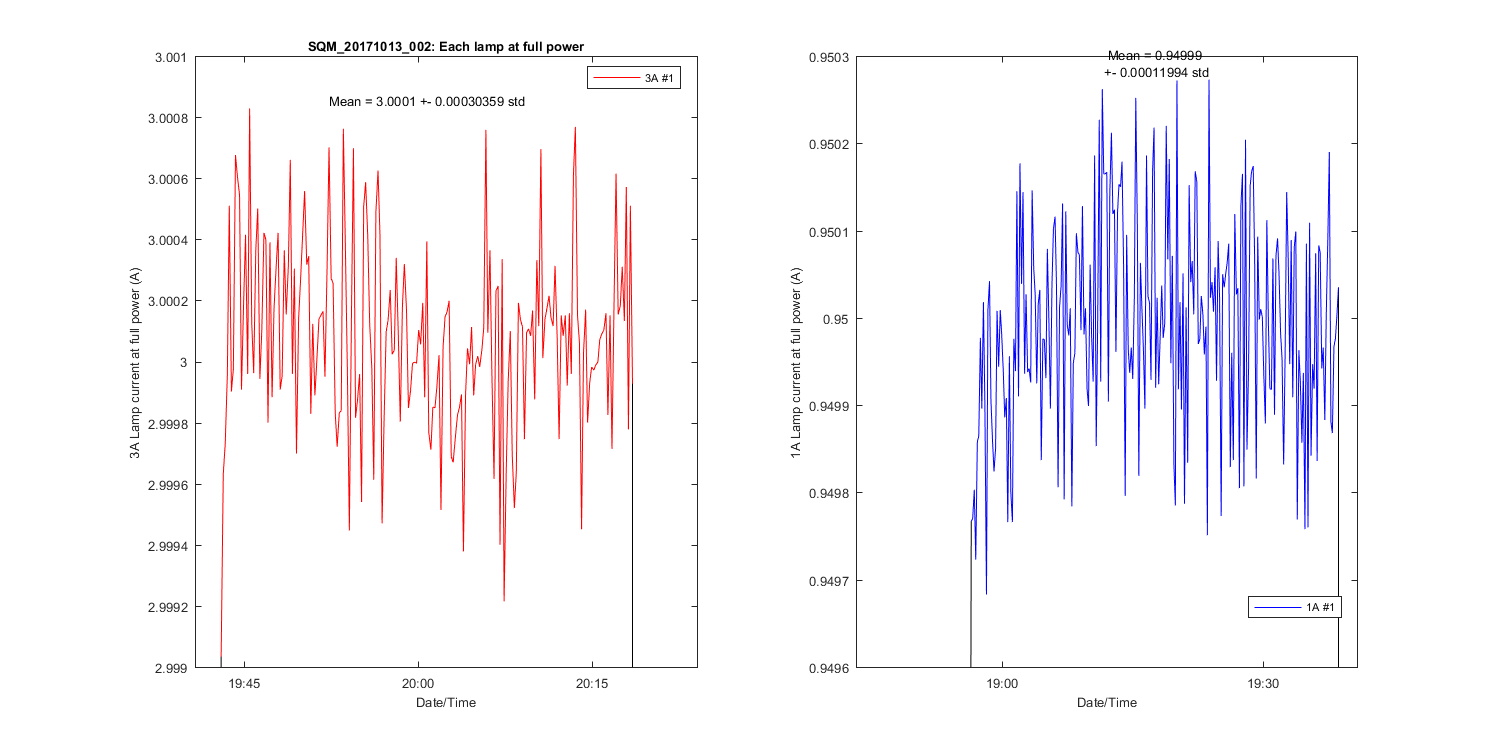
Figure 9
Figure 10