| Description | Value or Code |
|---|---|
| Cruise_Name:, Vaux(12,:) | NIST |
| Cruise_Number | 2017-002 |
| Investigator:: Vaux(16,:) | Carol Johnson |
| Location_of_Measurement: Vaux(17,:) | NIST B019_221 |
| Purpose: Vaux(18,:) | Stability Measurement |
| MOBY_NET_Sequence_Position: Vaux(20,:) | Calibration Facility |
| Ambient_Air_Temp (deg C) | 22.7 |
| Relative_Humidity (%) | 30.3 |
| #_of_Levels | 3 |
| Time_Step (sec) | 10 |
| Initial lamp state: Vaux(40,:) | All Off |
| Time_adjustment_to_GMT | 0 |
| Time_of_Last_Servicing | 20151218 |
| SQM_120VAC_On | 20171027.125830 |
| SQM_Off_to_Standby | 20171027.130035 |
| SQM_Standby_to_Off | 20171027.202746 |
| SQM_120VAC_Off | 20171027.203000 |
| Lamp 1 A burn hours | 0.68333 |
| Lamp 3 A burn hours | 0.81167 |
| DAQ_Program_Version | 19 |
| File Format Version | 2 |
| DAQ_Computer: Vaux(60,:) | EOS EQUIP 13 |
| DAQ_Program_Name: Vaux(61,:) | SQM Monitor_2.1.vi |
|
All Devices Under Test in the DUT column in DATA: DUT_White_Fiducial DUT_Black_Fiducial DUT_Net_CAS_Lu DUT_VXR DUT_SEI |
|
ASCII SQM file data: SQM_20171027_001.txt
ASCII SQM file data: PDF log file
| Lamp | On/Off # | N | Time on (hrs) | Mean (meas./set) | std | %std |
|---|---|---|---|---|---|---|
| Lamp 1A | 1 | 219 | 0.63667 | 0.94998 / 0.95 | 0.00012295 | 0.012942 |
| Lamp 3A | 1 | 238 | 0.69194 | 3.0001 / 3 | 0.0005792 | 0.019306 |
| Level | PD internal monitor (V) | Level Change # | Mean | std | %std |
|---|---|---|---|---|---|
| Low (1A) | Red | 1 | 0.2673 | 0.086579 | 32.3905 |
| Low (1A) | White | 1 | 0.25579 | 0.079189 | 33.8477 |
| Low (1A) | Blue | 1 | 0.21799 | 0.045124 | 39.7175 |
| Medium (3A) | Red | 3 | 1.2973 | 0.018581 | 1.4323 |
| Medium (3A) | White | 3 | 1.4288 | 0.021548 | 1.3005 |
| Medium (3A) | Blue | 3 | 1.3952 | 0.016722 | 1.3318 |
| Level | Temperature (C) | Level Change # | Mean | std | %std |
|---|---|---|---|---|---|
| Low (1A) | PD | 1 | 35.0401 | 0.10921 | 0.31168 |
| Medium (3A) | PD | 3 | 34.9596 | 0.11943 | 0.34162 |
Red PD (max value): 1.3398: #of possible satureated values 0
White PD (max value): 1.4861: #of possible satureated values 0
Blue PD (max value): 1.4277: #of possible satureated values 0
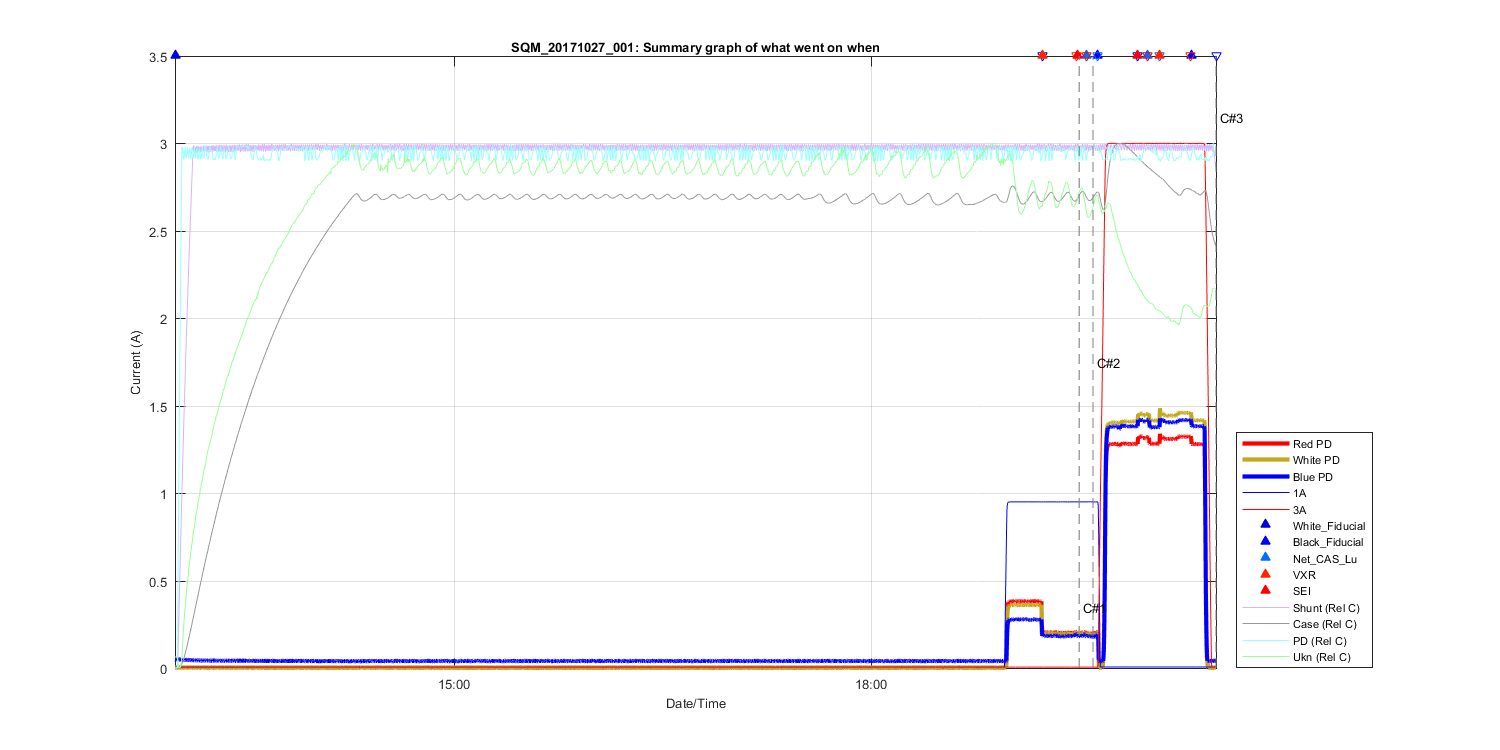
Figure 1
Summary Graph showing all measurements taken in this file, including auxilliary temperature measurements and comments. The text C# shows what time in the file the comments (shown above where made). The triangles at the top of the figure shows then a DUT (Device under test) was placed in front of the SQM and removed.
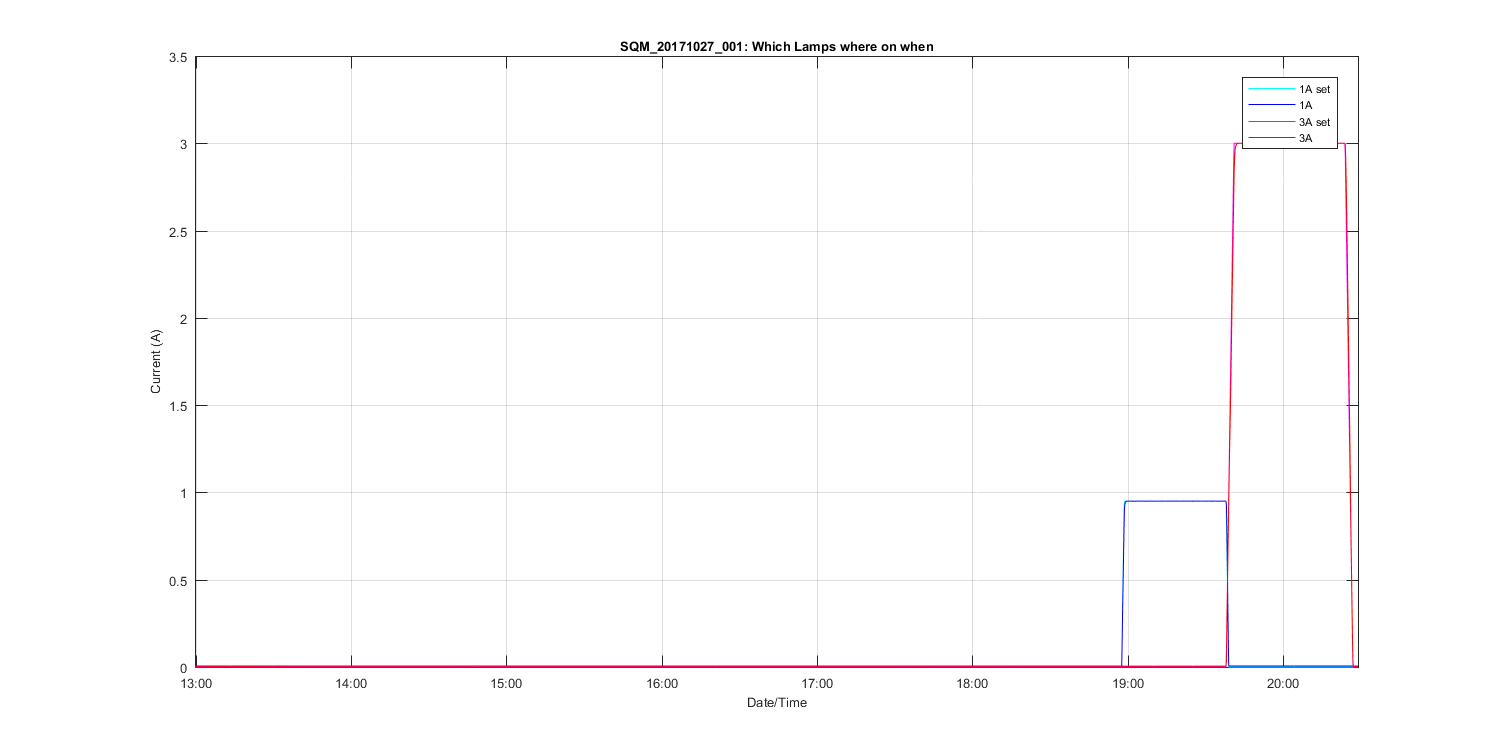
Figure 2
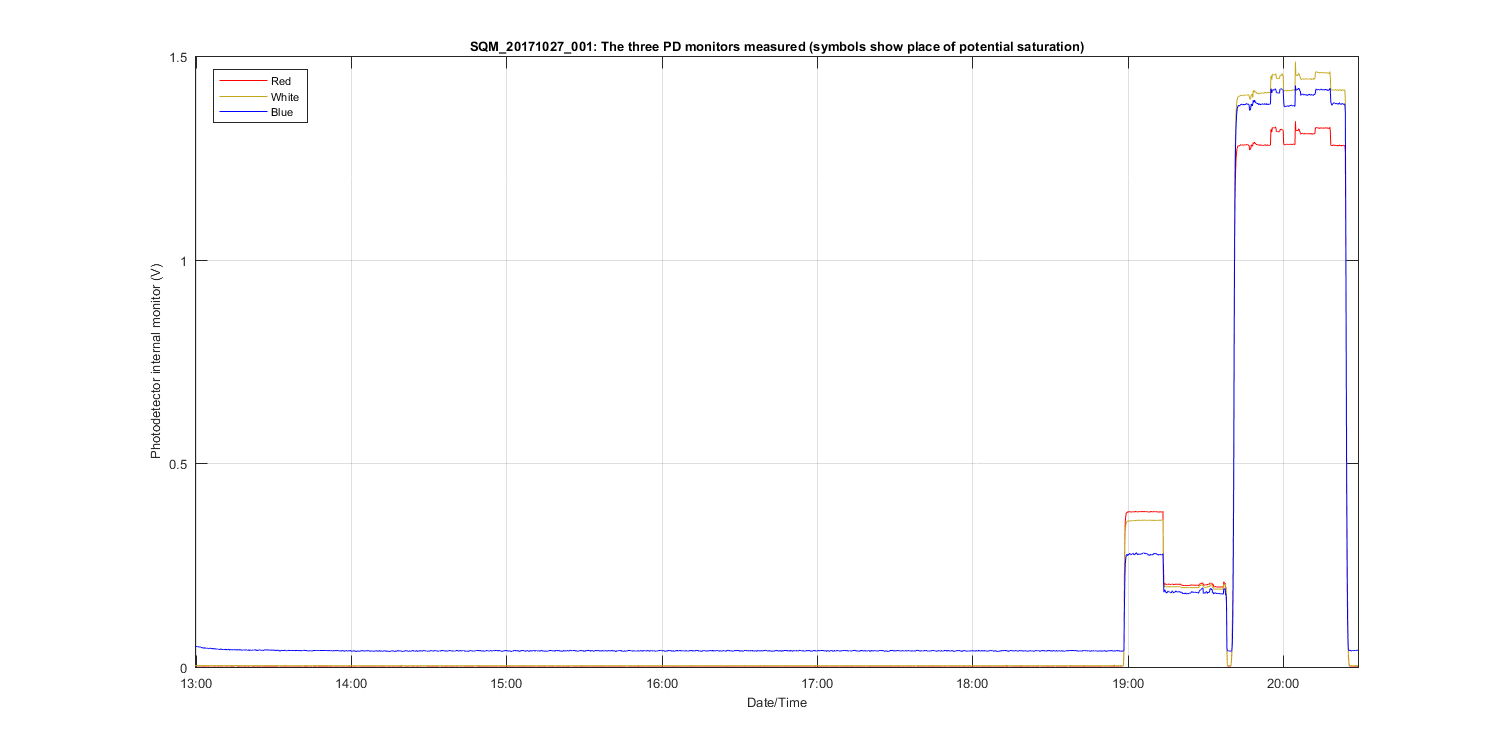
Figure 3
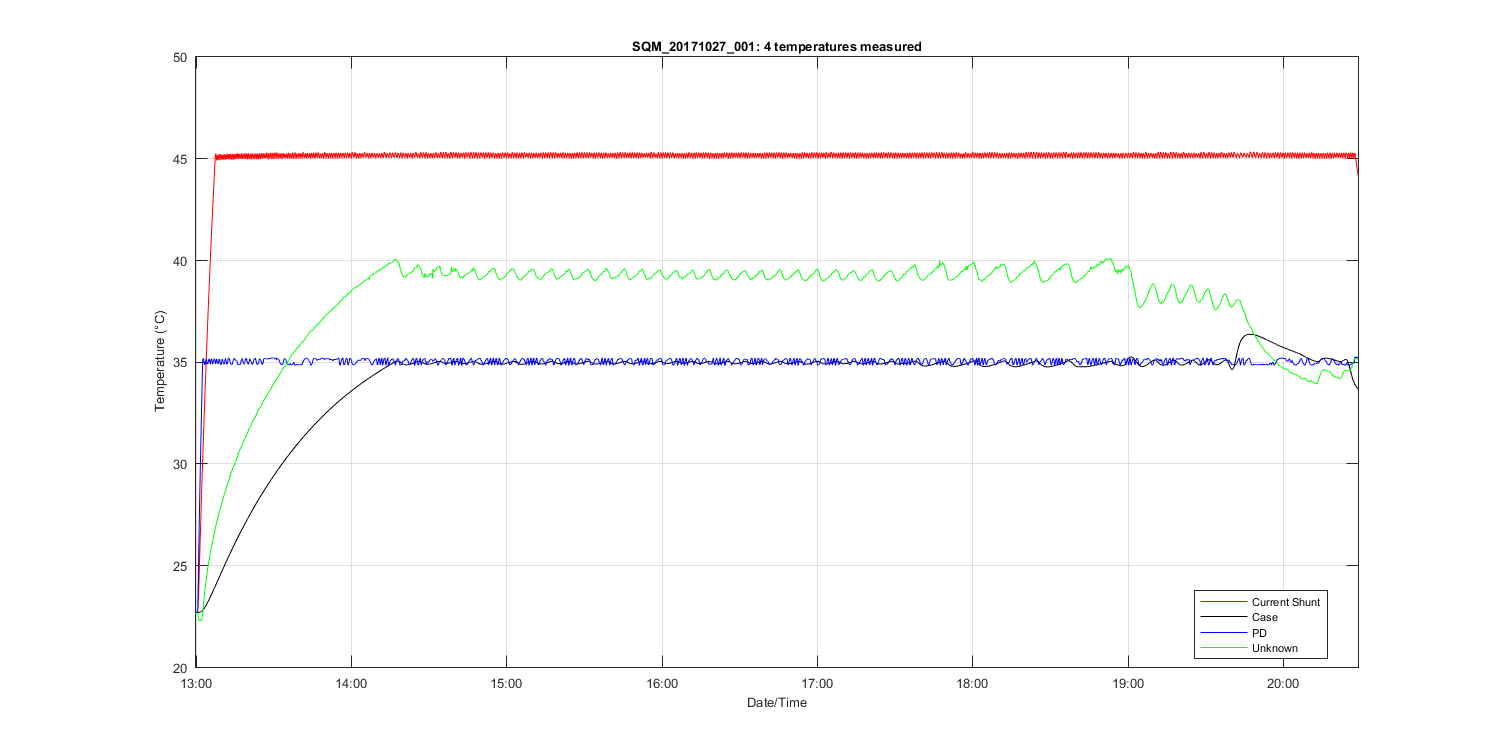
Figure 4
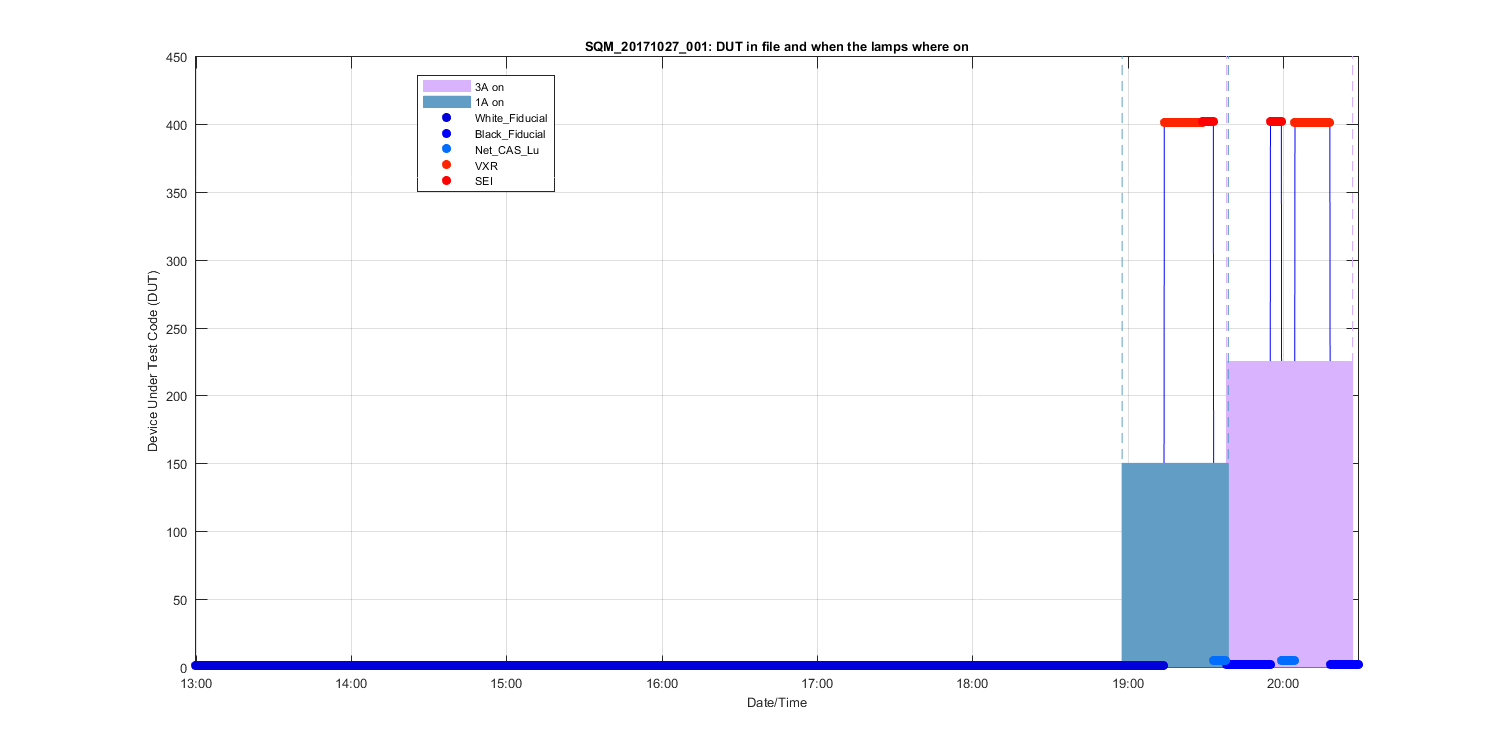
Figure 5
Figure 6
Figure 7
Figure 8
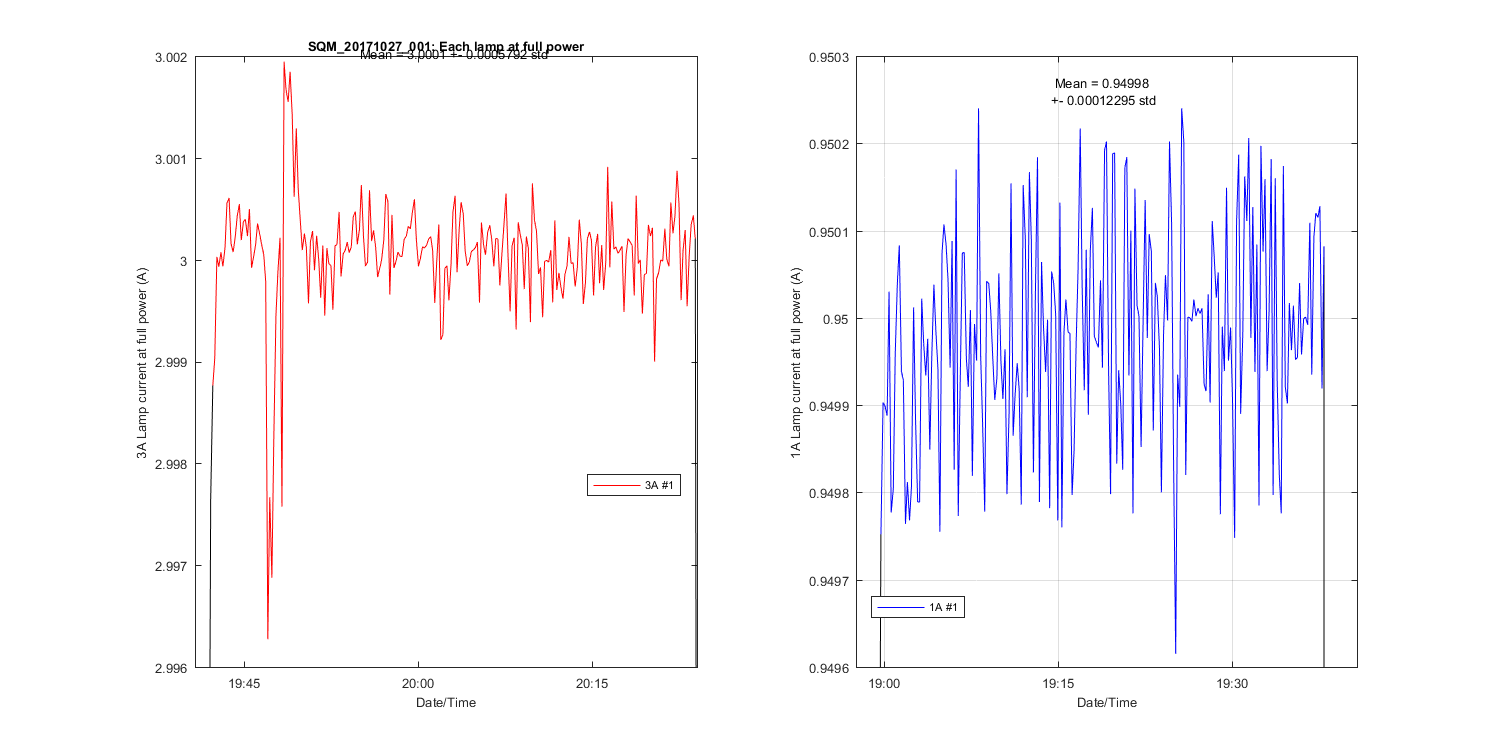
Figure 9
Figure 10