| Description | Value or Code |
|---|---|
| Cruise_Name:, Vaux(12,:) | NIST |
| Cruise_Number | 2017-002 |
| Investigator:: Vaux(16,:) | Carol Johnson |
| Location_of_Measurement: Vaux(17,:) | NIST B019_221 |
| Purpose: Vaux(18,:) | Stability Measurement |
| MOBY_NET_Sequence_Position: Vaux(20,:) | Calibration Facility |
| Ambient_Air_Temp (deg C) | 22.4 |
| Relative_Humidity (%) | 50.9 |
| #_of_Levels | 3 |
| Time_Step (sec) | 10 |
| Initial lamp state: Vaux(40,:) | All Off |
| Time_adjustment_to_GMT | 0 |
| Time_of_Last_Servicing | 20151218 |
| SQM_120VAC_On | 20171103.183200 |
| SQM_Off_to_Standby | 20171103.183401 |
| SQM_Standby_to_Off | 20171103.202821 |
| SQM_120VAC_Off | 20171103.203000 |
| Lamp 1 A burn hours | 0.72722 |
| Lamp 3 A burn hours | 0.71861 |
| DAQ_Program_Version | 19 |
| File Format Version | 2 |
| DAQ_Computer: Vaux(60,:) | EOS EQUIP 13 |
| DAQ_Program_Name: Vaux(61,:) | SQM Monitor_2.1.vi |
|
All Devices Under Test in the DUT column in DATA: DUT_White_Fiducial DUT_Black_Fiducial DUT_Net_CAS_Lu DUT_VXR DUT_SEI |
|
ASCII SQM file data: SQM_20171103_001.txt
ASCII SQM file data: PDF log file
| Lamp | On/Off # | N | Time on (hrs) | Mean (meas./set) | std | %std |
|---|---|---|---|---|---|---|
| Lamp 1A | 1 | 233 | 0.6775 | 0.94998 / 0.95 | 0.00012297 | 0.012945 |
| Lamp 3A | 1 | 207 | 0.60167 | 2.9999 / 3 | 0.00096911 | 0.032304 |
| Level | PD internal monitor (V) | Level Change # | Mean | std | %std |
|---|---|---|---|---|---|
| Low (1A) | Red | 1 | 0.26516 | 0.085474 | 32.2346 |
| Low (1A) | White | 1 | 0.25524 | 0.079363 | 33.4872 |
| Low (1A) | Blue | 1 | 0.21731 | 0.044755 | 39.332 |
| Medium (3A) | Red | 3 | 1.3015 | 0.021206 | 1.6293 |
| Medium (3A) | White | 3 | 1.431 | 0.022418 | 1.4819 |
| Medium (3A) | Blue | 3 | 1.3979 | 0.017558 | 1.517 |
| Level | Temperature (C) | Level Change # | Mean | std | %std |
|---|---|---|---|---|---|
| Low (1A) | PD | 1 | 34.9808 | 0.12103 | 0.34599 |
| Medium (3A) | PD | 3 | 34.9473 | 0.1057 | 0.30245 |
Red PD (max value): 1.4027: #of possible satureated values 0
White PD (max value): 1.5105: #of possible satureated values 0
Blue PD (max value): 1.4358: #of possible satureated values 0
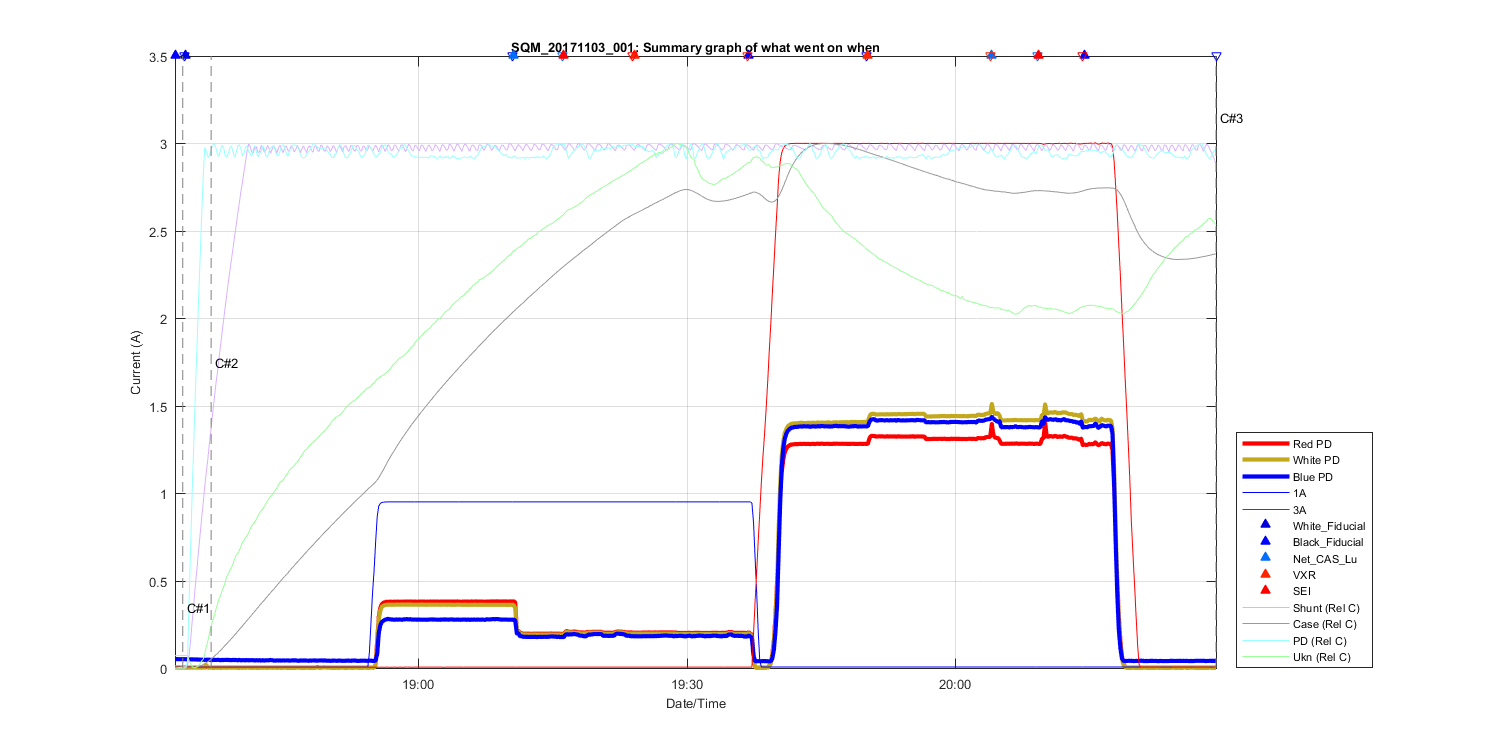
Figure 1
Summary Graph showing all measurements taken in this file, including auxilliary temperature measurements and comments. The text C# shows what time in the file the comments (shown above where made). The triangles at the top of the figure shows then a DUT (Device under test) was placed in front of the SQM and removed.
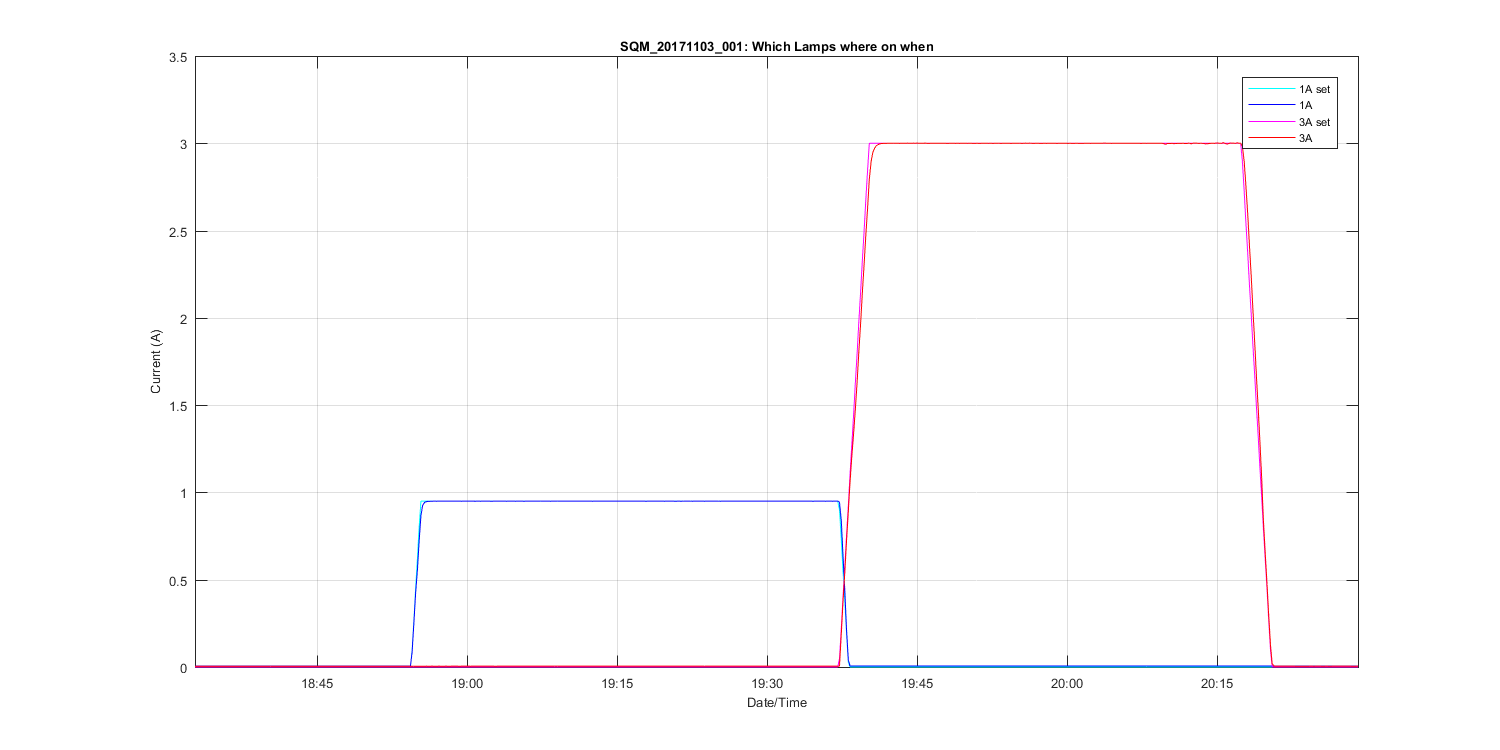
Figure 2
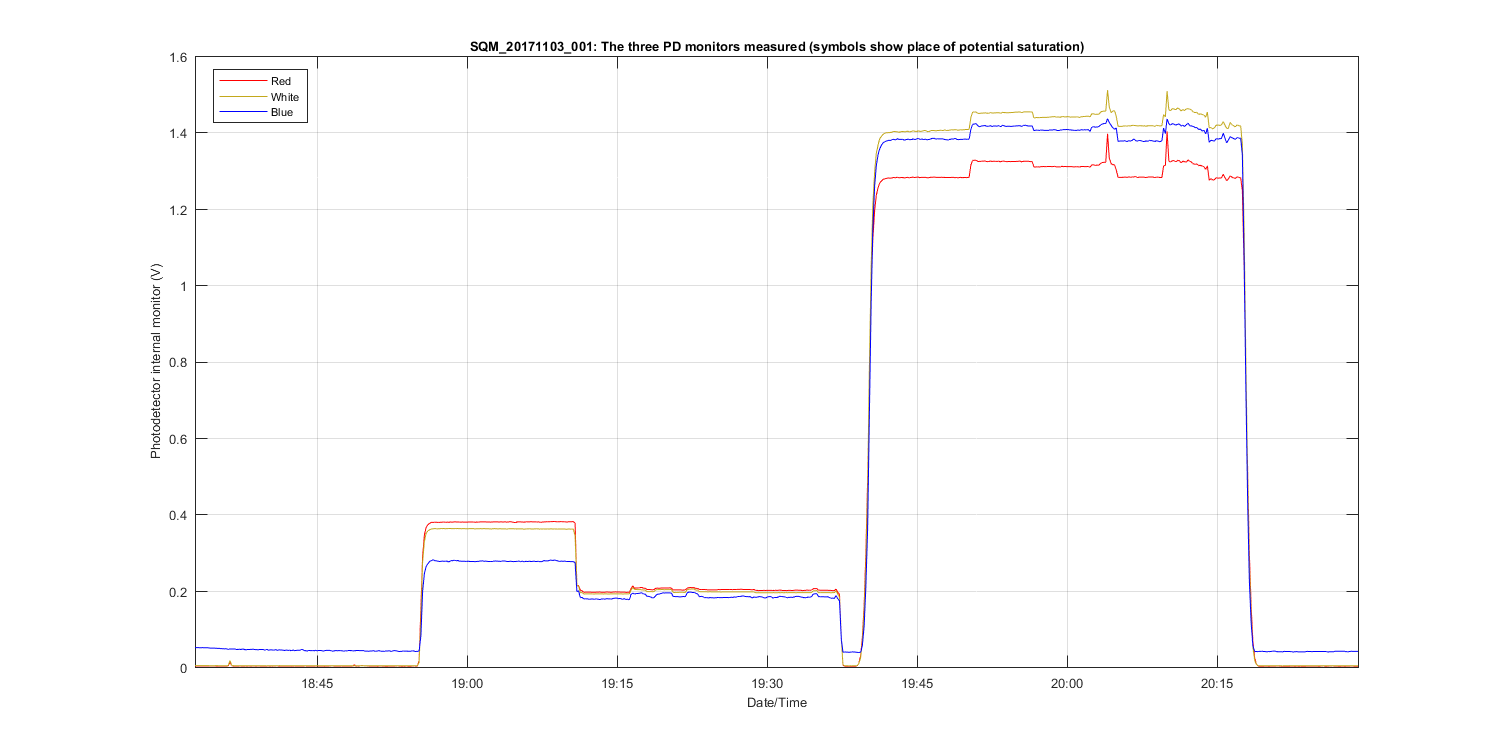
Figure 3
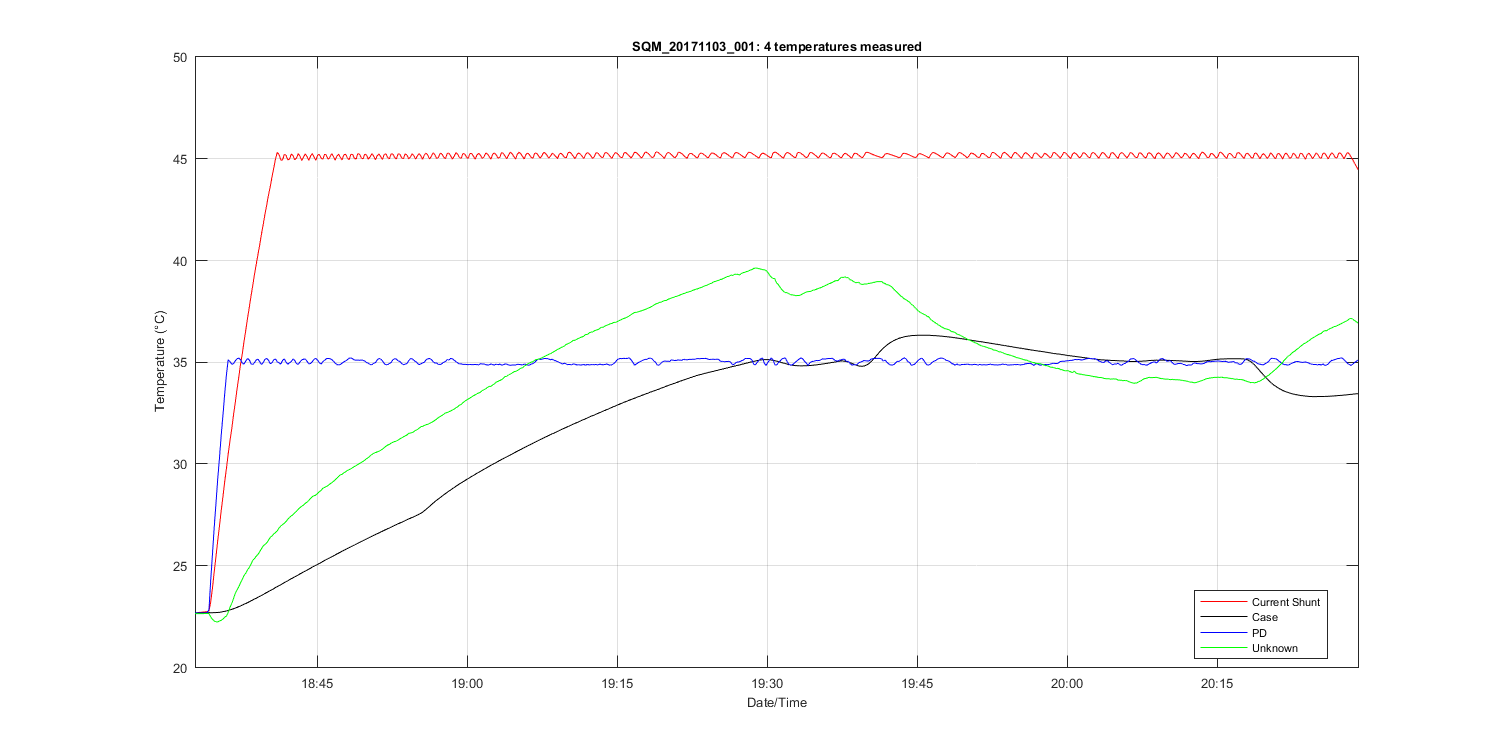
Figure 4
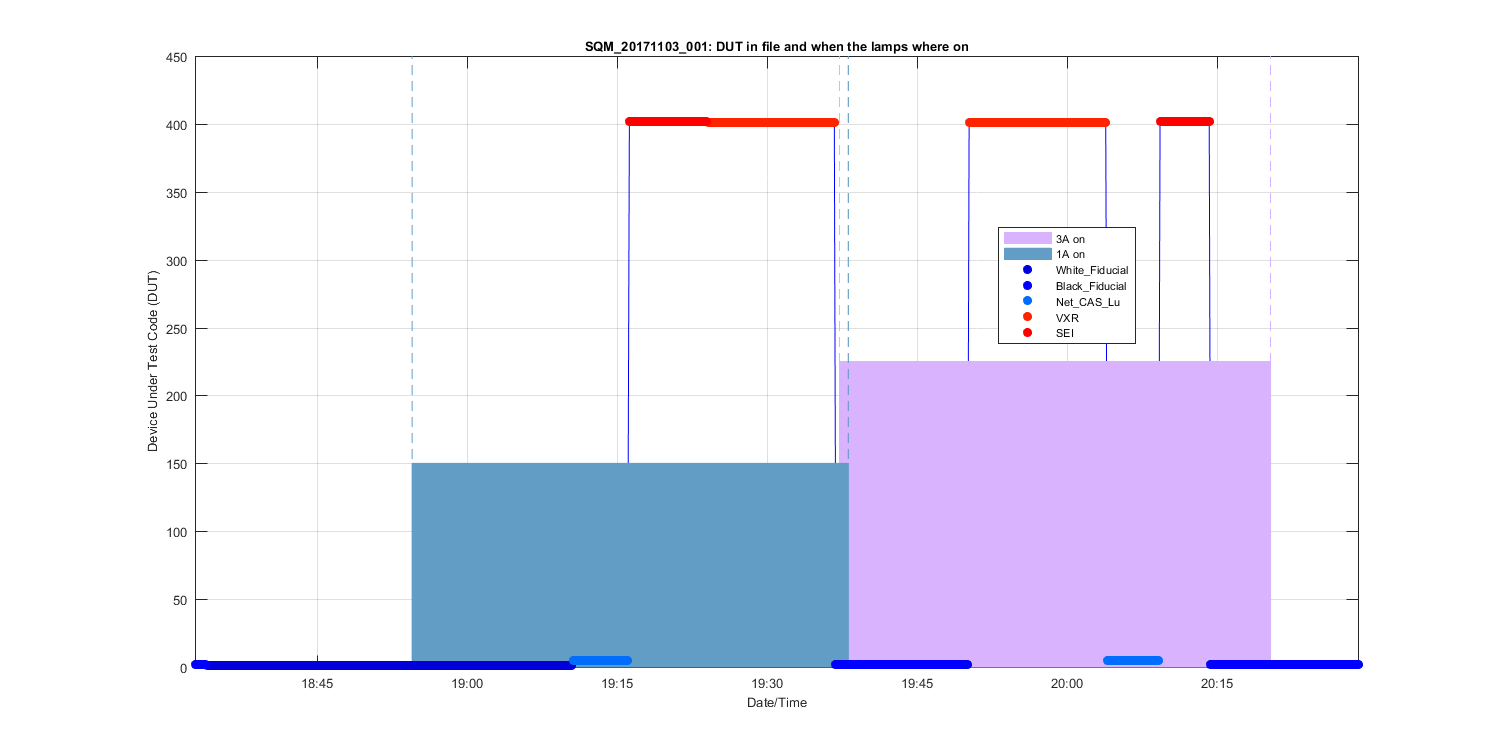
Figure 5
Figure 6
Figure 7
Figure 8
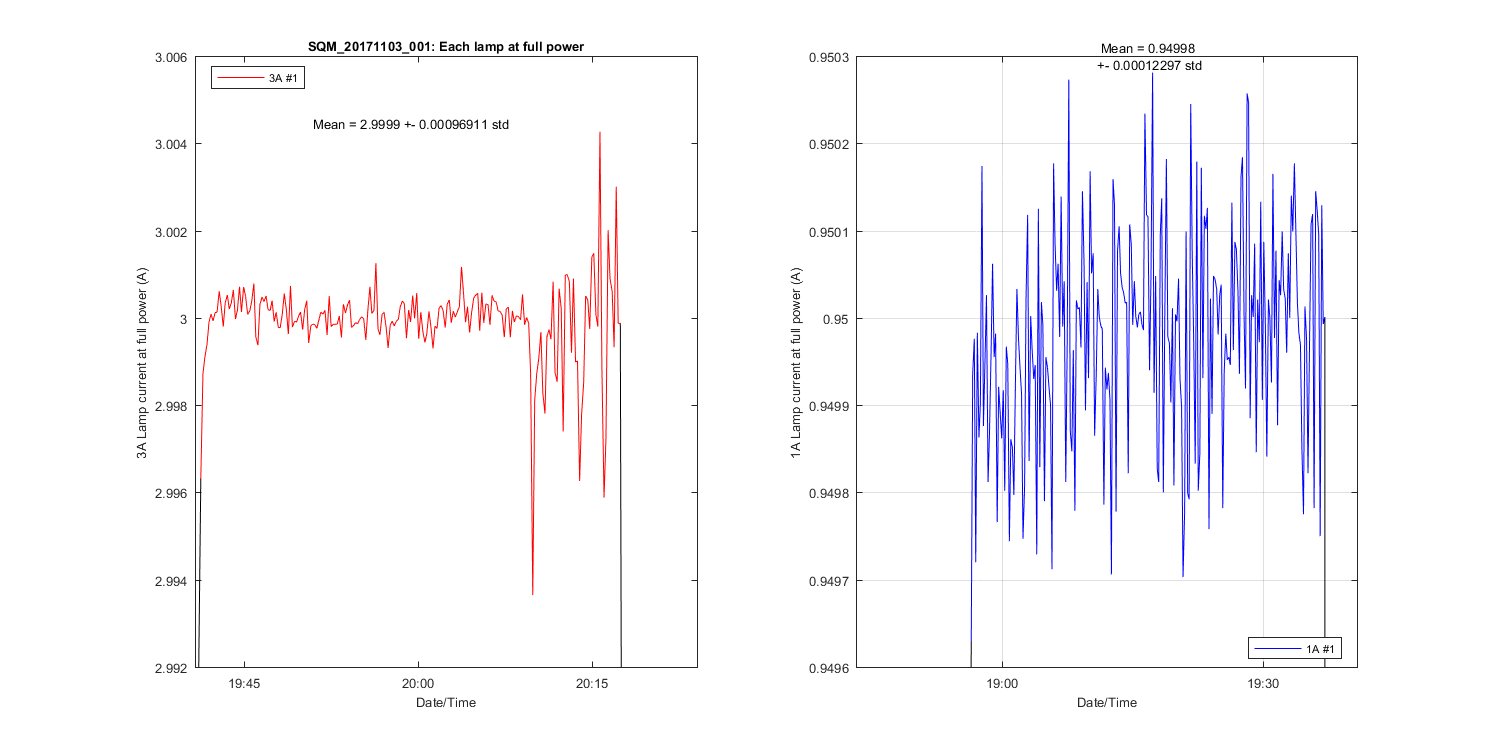
Figure 9
Figure 10