| Description | Value or Code |
|---|---|
| Cruise_Name:, Vaux(12,:) | NIST |
| Cruise_Number | 2017-002 |
| Investigator:: Vaux(16,:) | Carol Johnson |
| Location_of_Measurement: Vaux(17,:) | NIST B019_221 |
| Purpose: Vaux(18,:) | Stability Measurement |
| MOBY_NET_Sequence_Position: Vaux(20,:) | Calibration Facility |
| Ambient_Air_Temp (deg C) | 22.8 |
| Relative_Humidity (%) | 23.4 |
| #_of_Levels | 3 |
| Time_Step (sec) | 10 |
| Initial lamp state: Vaux(40,:) | All Off |
| Time_adjustment_to_GMT | 0 |
| Time_of_Last_Servicing | 20151218 |
| SQM_120VAC_On | 20171117.145500 |
| SQM_Off_to_Standby | 20171117.145724 |
| SQM_Standby_to_Off | 20171117.170110 |
| SQM_120VAC_Off | 20171117.170300 |
| Lamp 1 A burn hours | 0.73 |
| Lamp 3 A burn hours | 0.98111 |
| DAQ_Program_Version | 19 |
| File Format Version | 2 |
| DAQ_Computer: Vaux(60,:) | EOS EQUIP 13 |
| DAQ_Program_Name: Vaux(61,:) | SQM Monitor_2.1.vi |
|
All Devices Under Test in the DUT column in DATA: DUT_White_Fiducial DUT_Black_Fiducial DUT_Net_CAS_Lu DUT_VXR DUT_SEI |
|
ASCII SQM file data: SQM_20171117_001.txt
ASCII SQM file data: PDF log file
| Lamp | On/Off # | N | Time on (hrs) | Mean (meas./set) | std | %std |
|---|---|---|---|---|---|---|
| Lamp 1A | 1 | 235 | 0.68333 | 0.94997 / 0.95 | 0.00011914 | 0.012542 |
| Lamp 3A | 1 | 297 | 0.86444 | 3 / 3 | 0.0009414 | 0.03138 |
| Level | PD internal monitor (V) | Level Change # | Mean | std | %std |
|---|---|---|---|---|---|
| Low (1A) | Red | 1 | 0.25892 | 0.08333 | 32.1839 |
| Low (1A) | White | 1 | 0.24918 | 0.077357 | 33.4413 |
| Low (1A) | Blue | 1 | 0.21399 | 0.043661 | 38.9408 |
| Medium (3A) | Red | 3 | 1.2982 | 0.018632 | 1.4352 |
| Medium (3A) | White | 3 | 1.4301 | 0.021972 | 1.3029 |
| Medium (3A) | Blue | 3 | 1.3973 | 0.016938 | 1.3334 |
| Level | Temperature (C) | Level Change # | Mean | std | %std |
|---|---|---|---|---|---|
| Low (1A) | PD | 1 | 34.9693 | 0.11958 | 0.34197 |
| Medium (3A) | PD | 3 | 34.9824 | 0.11327 | 0.32379 |
Red PD (max value): 1.338: #of possible satureated values 0
White PD (max value): 1.4775: #of possible satureated values 0
Blue PD (max value): 1.4457: #of possible satureated values 0
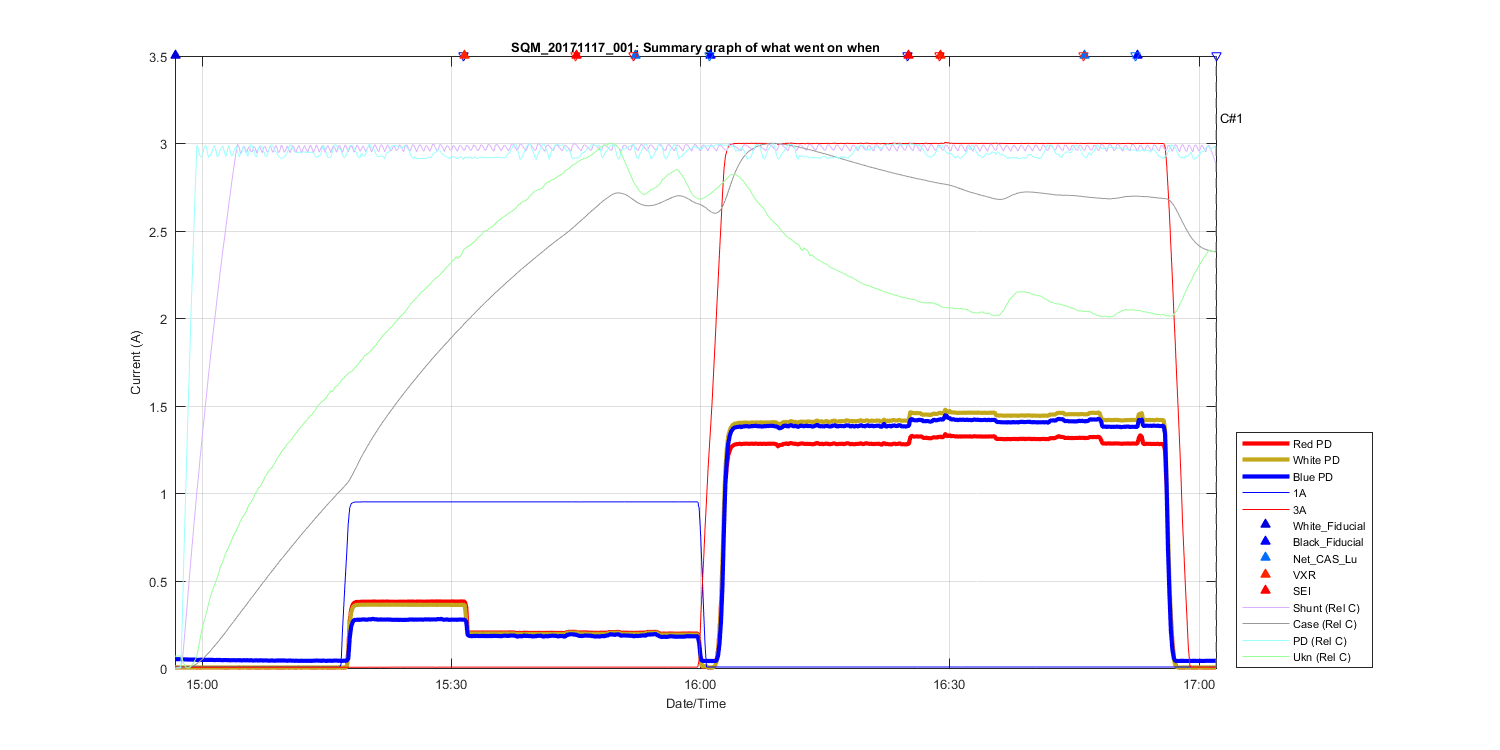
Figure 1
Summary Graph showing all measurements taken in this file, including auxilliary temperature measurements and comments. The text C# shows what time in the file the comments (shown above where made). The triangles at the top of the figure shows then a DUT (Device under test) was placed in front of the SQM and removed.
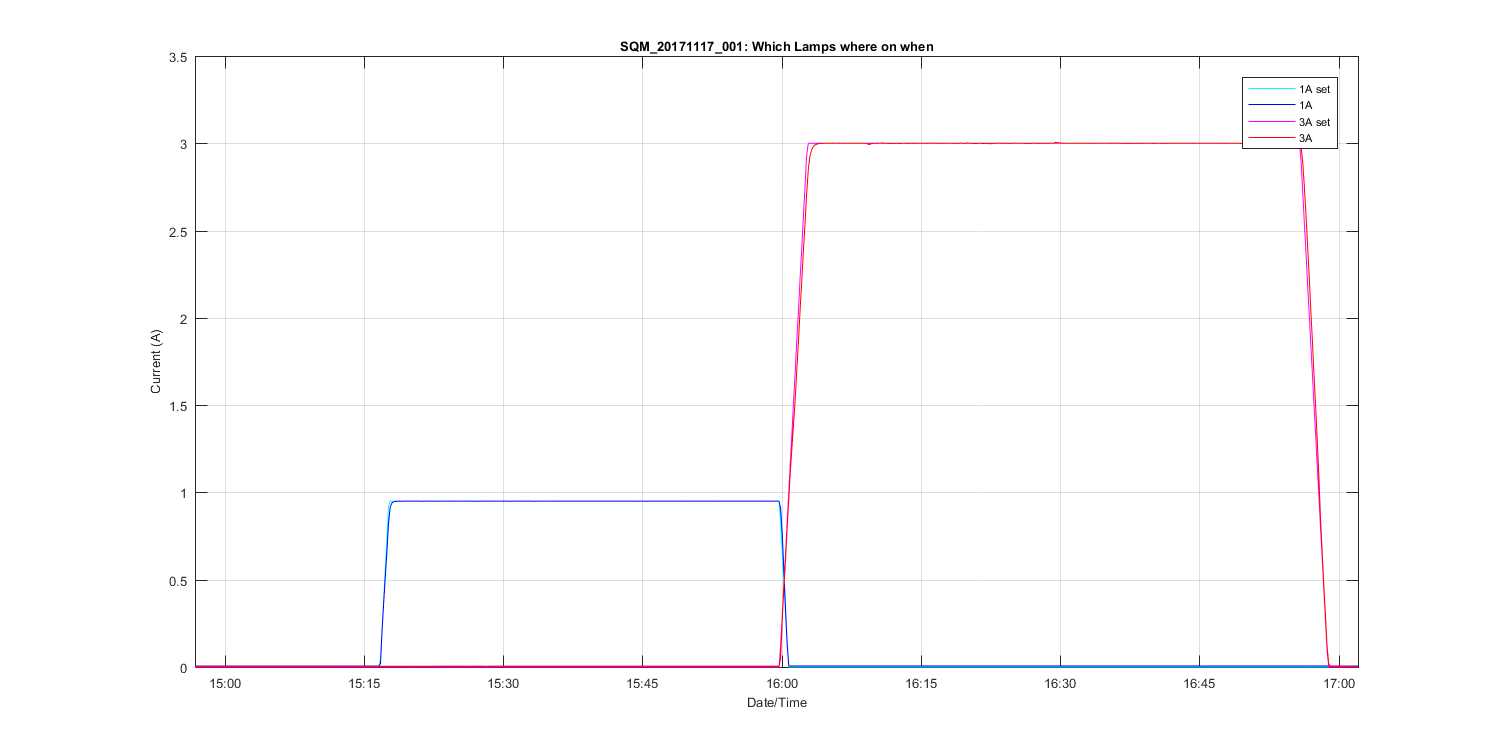
Figure 2
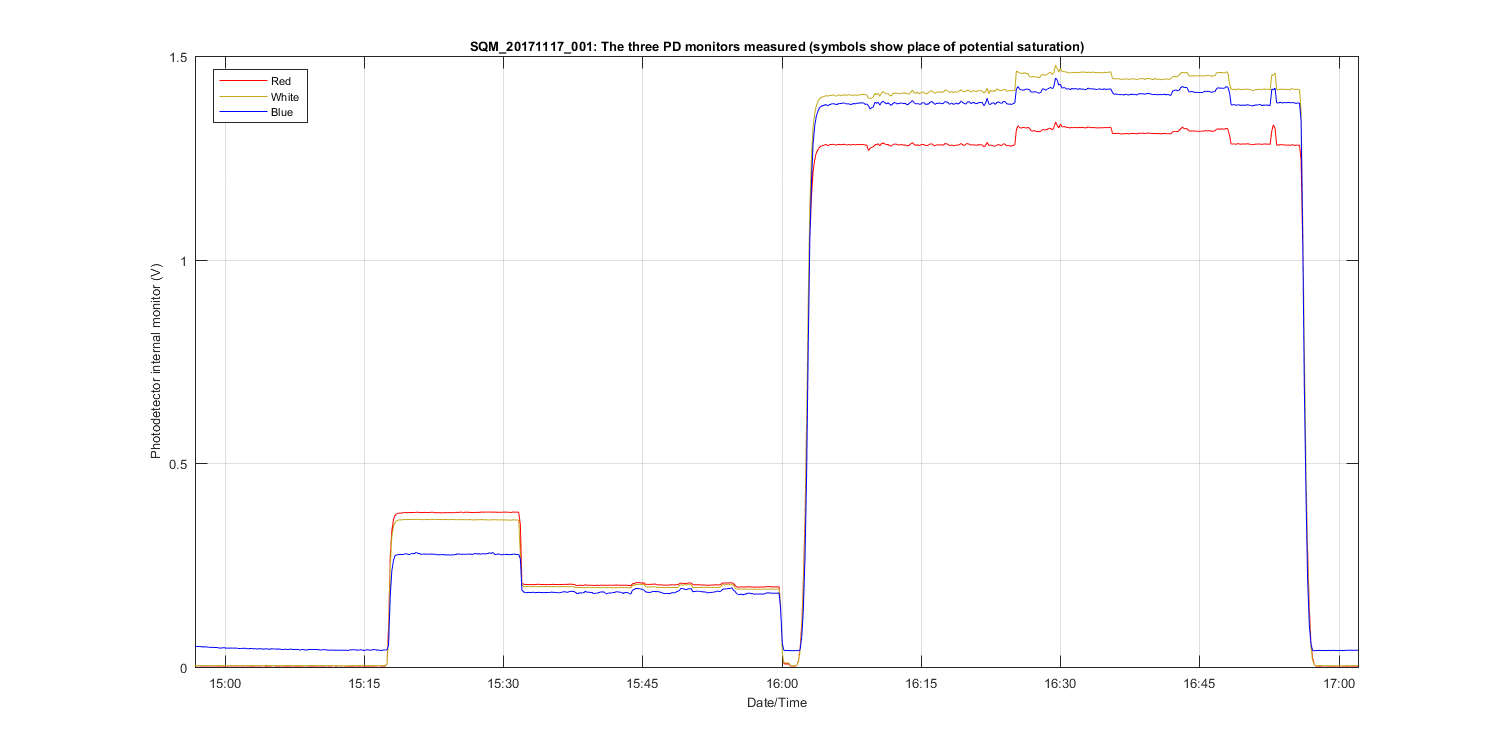
Figure 3
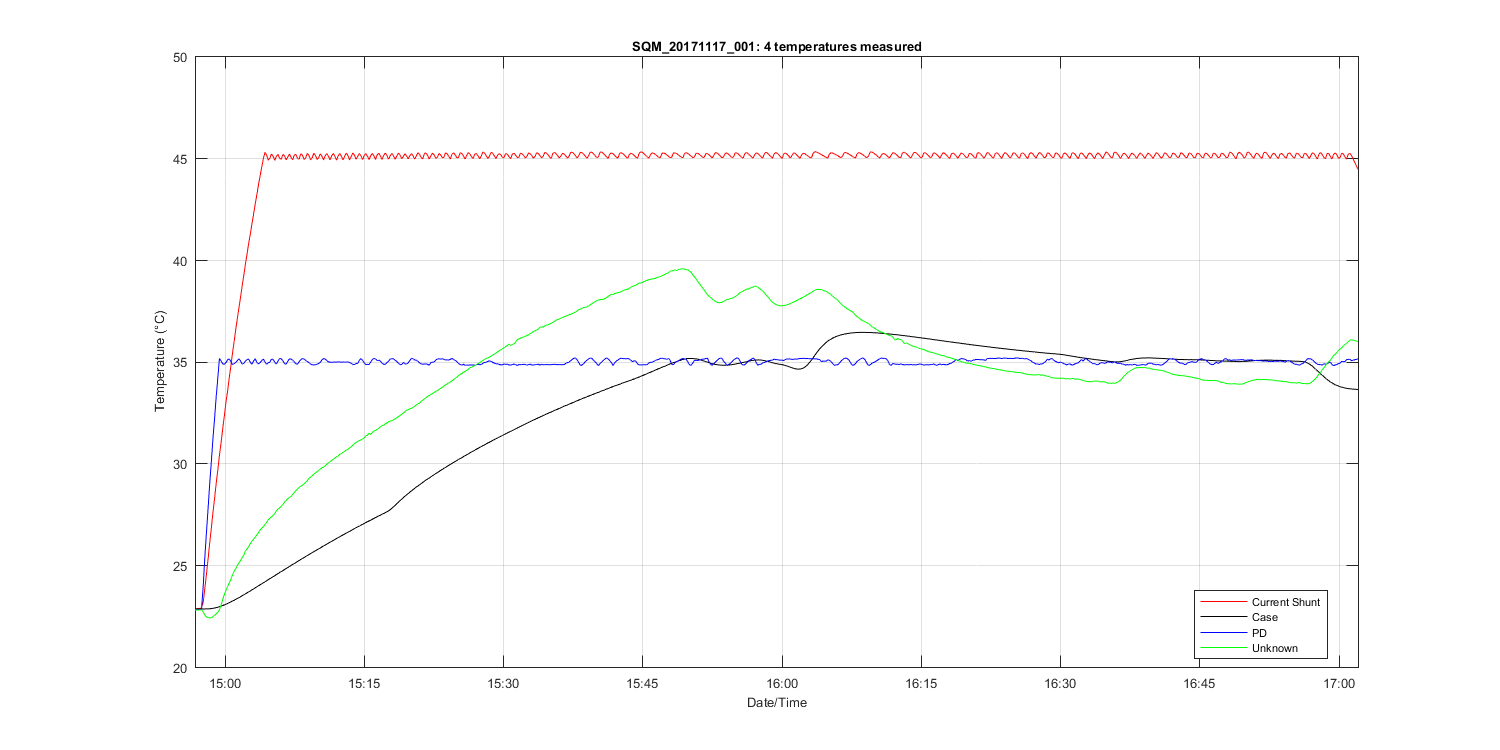
Figure 4
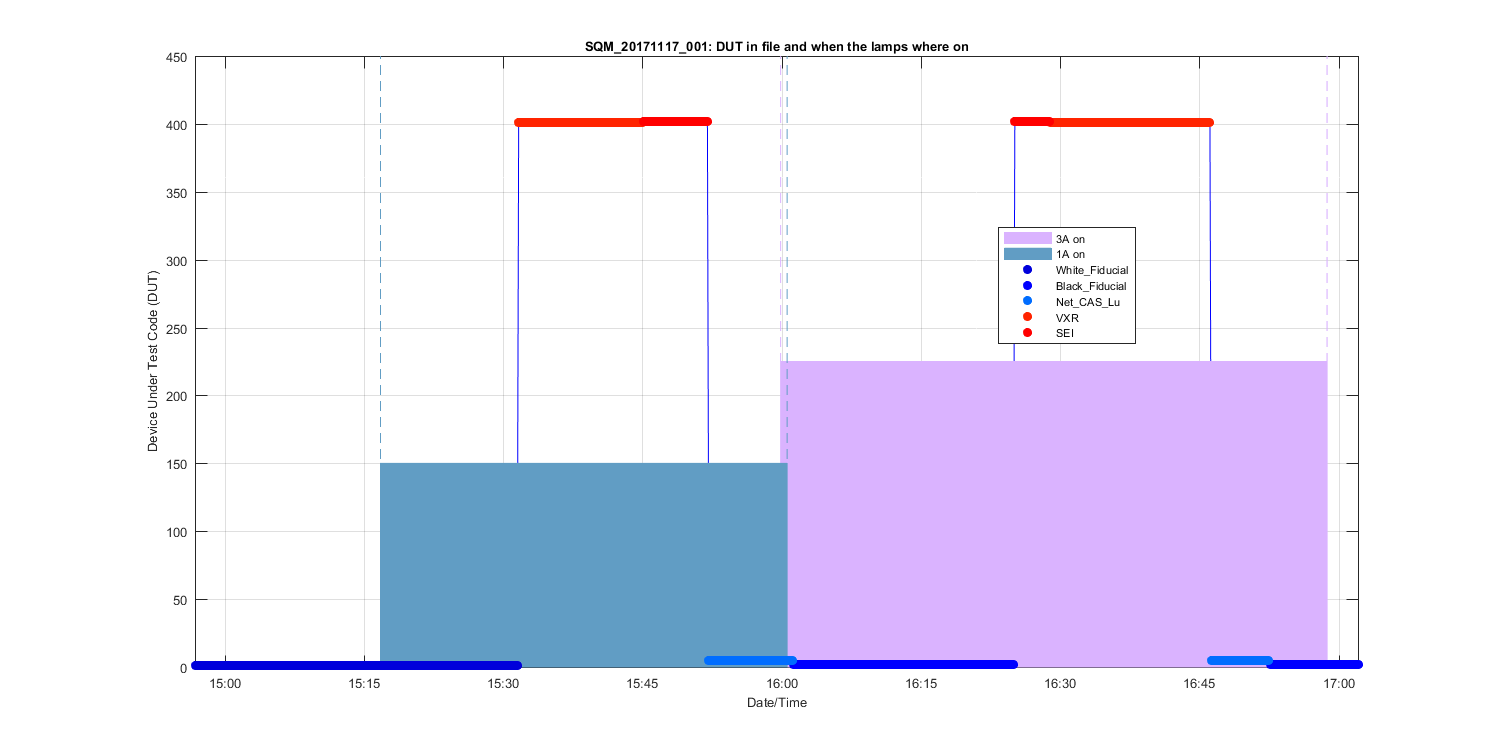
Figure 5
Figure 6
Figure 7
Figure 8
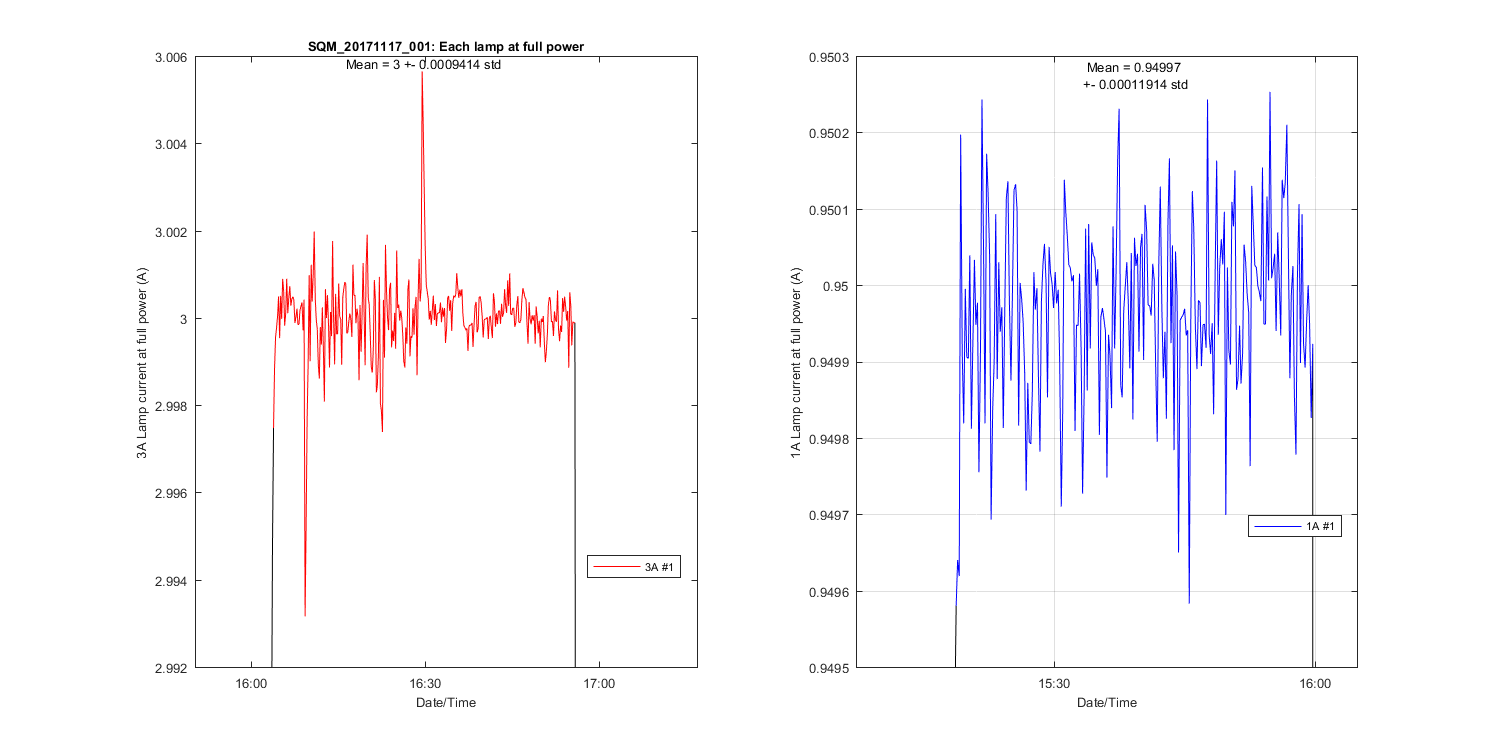
Figure 9
Figure 10