| Description | Value or Code |
|---|---|
| Cruise_Name:, Vaux(12,:) | NIST |
| Cruise_Number | 2017-002 |
| Investigator:: Vaux(16,:) | Carol Johnson |
| Location_of_Measurement: Vaux(17,:) | NIST B019_221 |
| Purpose: Vaux(18,:) | Stability Measurement |
| MOBY_NET_Sequence_Position: Vaux(20,:) | Calibration Facility |
| Ambient_Air_Temp (deg C) | 22.9 |
| Relative_Humidity (%) | 18 |
| #_of_Levels | 3 |
| Time_Step (sec) | 10 |
| Initial lamp state: Vaux(40,:) | All Off |
| Time_adjustment_to_GMT | 0 |
| Time_of_Last_Servicing | 20151218 |
| SQM_120VAC_On | 20171120.191400 |
| SQM_Off_to_Standby | 20171120.191810 |
| SQM_Standby_to_Off | 20171120.210935 |
| SQM_120VAC_Off | 20171120.211100 |
| Lamp 1 A burn hours | 1.0833 |
| Lamp 3 A burn hours | 0.49639 |
| DAQ_Program_Version | 19 |
| File Format Version | 2 |
| DAQ_Computer: Vaux(60,:) | EOS EQUIP 13 |
| DAQ_Program_Name: Vaux(61,:) | SQM Monitor_2.1.vi |
|
All Devices Under Test in the DUT column in DATA: DUT_White_Fiducial DUT_Black_Fiducial DUT_Net_CAS_Lu |
|
ASCII SQM file data: SQM_20171120_001.txt
ASCII SQM file data: PDF log file
| Lamp | On/Off # | N | Time on (hrs) | Mean (meas./set) | std | %std |
|---|---|---|---|---|---|---|
| Lamp 1A | 1 | 355 | 1.0336 | 0.94998 / 0.95 | 0.00011117 | 0.011702 |
| Lamp 3A | 1 | 131 | 0.37944 | 3.0001 / 3 | 0.0010551 | 0.03517 |
| Level | PD internal monitor (V) | Level Change # | Mean | std | %std |
|---|---|---|---|---|---|
| Low (1A) | Red | 1 | 0.30925 | 0.089566 | 28.9625 |
| Low (1A) | White | 1 | 0.29538 | 0.082577 | 30.3224 |
| Low (1A) | Blue | 1 | 0.24033 | 0.047497 | 37.2677 |
| Medium (3A) | Red | 3 | 1.2833 | 0.0070172 | 0.54679 |
| Medium (3A) | White | 3 | 1.4111 | 0.0094683 | 0.4973 |
| Medium (3A) | Blue | 3 | 1.3835 | 0.0076867 | 0.50719 |
| Level | Temperature (C) | Level Change # | Mean | std | %std |
|---|---|---|---|---|---|
| Low (1A) | PD | 1 | 35.0124 | 0.11113 | 0.31741 |
| Medium (3A) | PD | 3 | 34.9517 | 0.11184 | 0.31998 |
Red PD (max value): 1.3294: #of possible satureated values 0
White PD (max value): 1.4652: #of possible satureated values 0
Blue PD (max value): 1.4248: #of possible satureated values 0
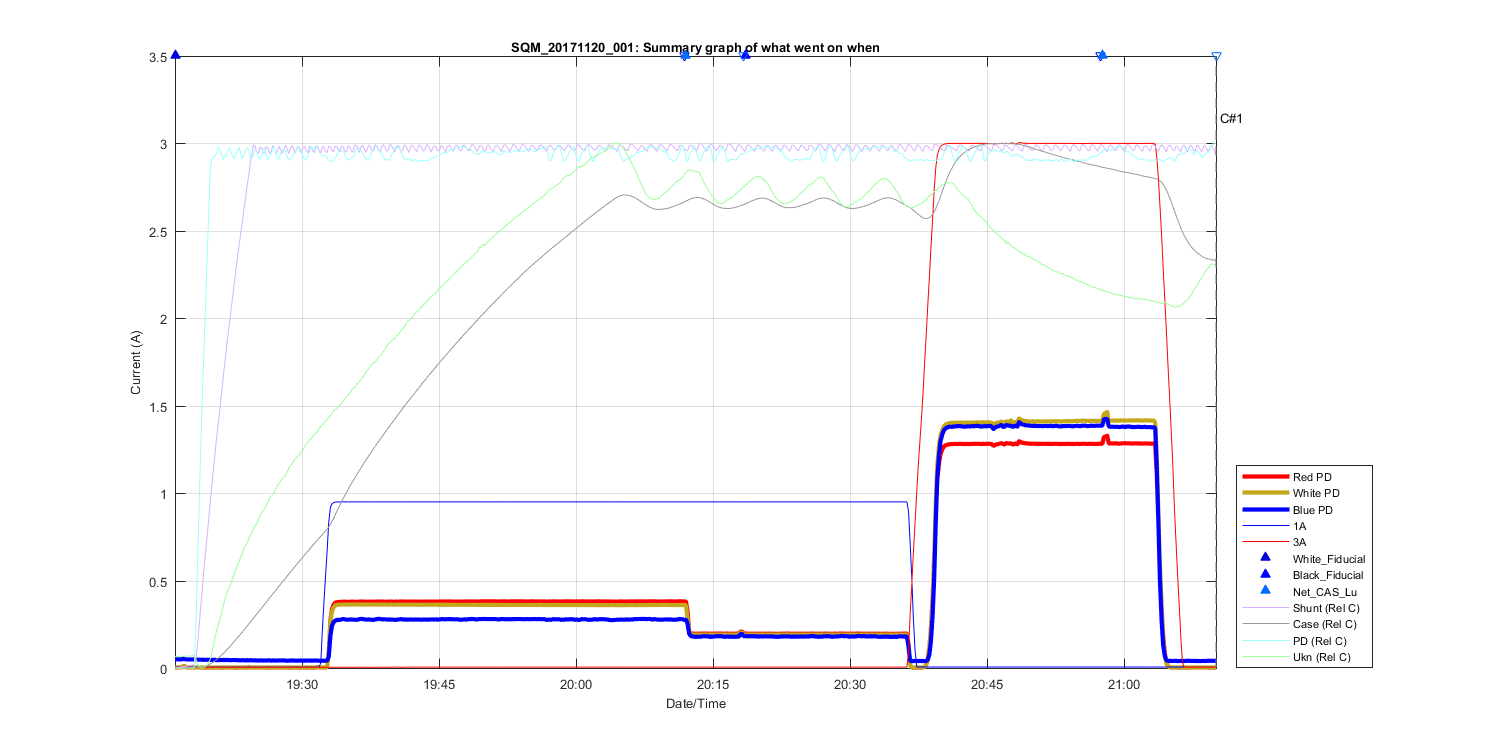
Figure 1
Summary Graph showing all measurements taken in this file, including auxilliary temperature measurements and comments. The text C# shows what time in the file the comments (shown above where made). The triangles at the top of the figure shows then a DUT (Device under test) was placed in front of the SQM and removed.
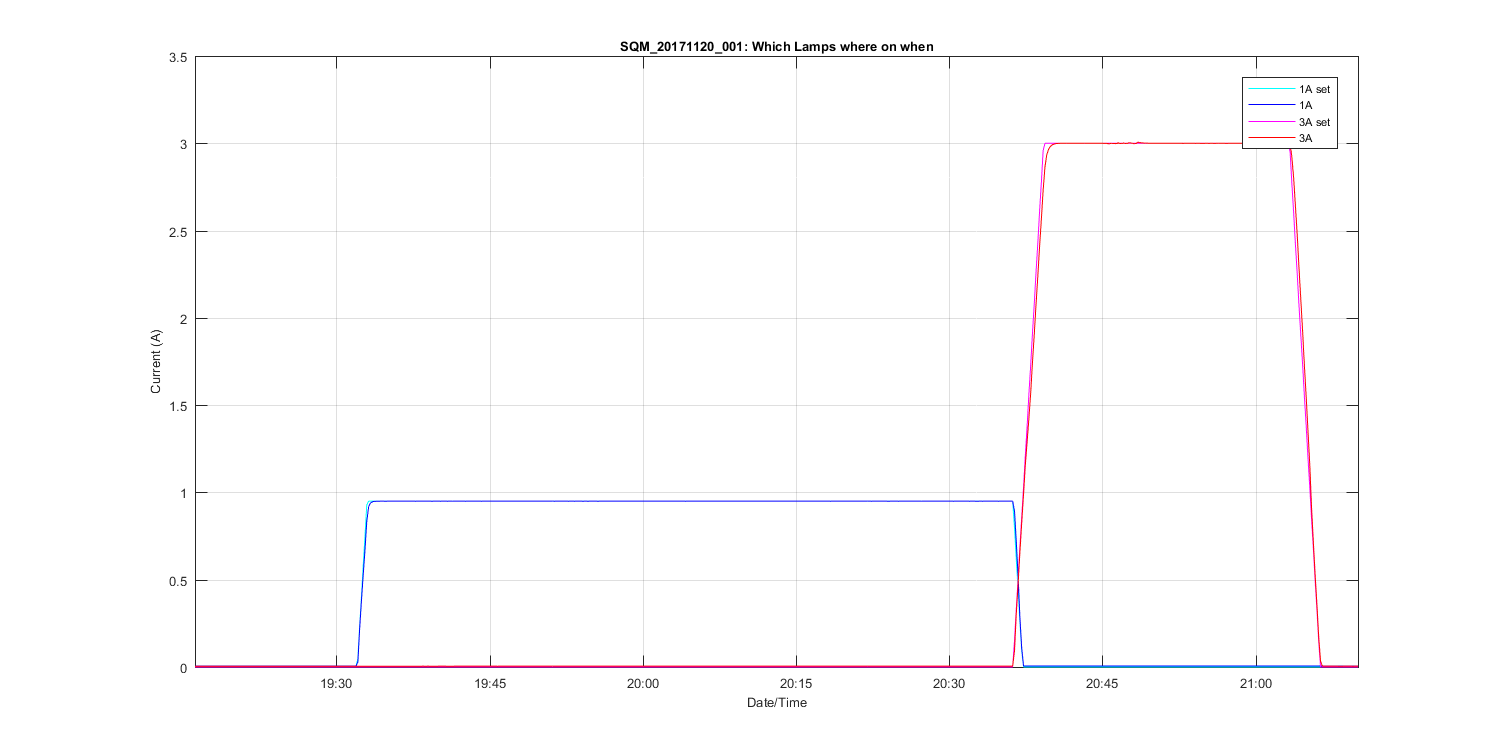
Figure 2
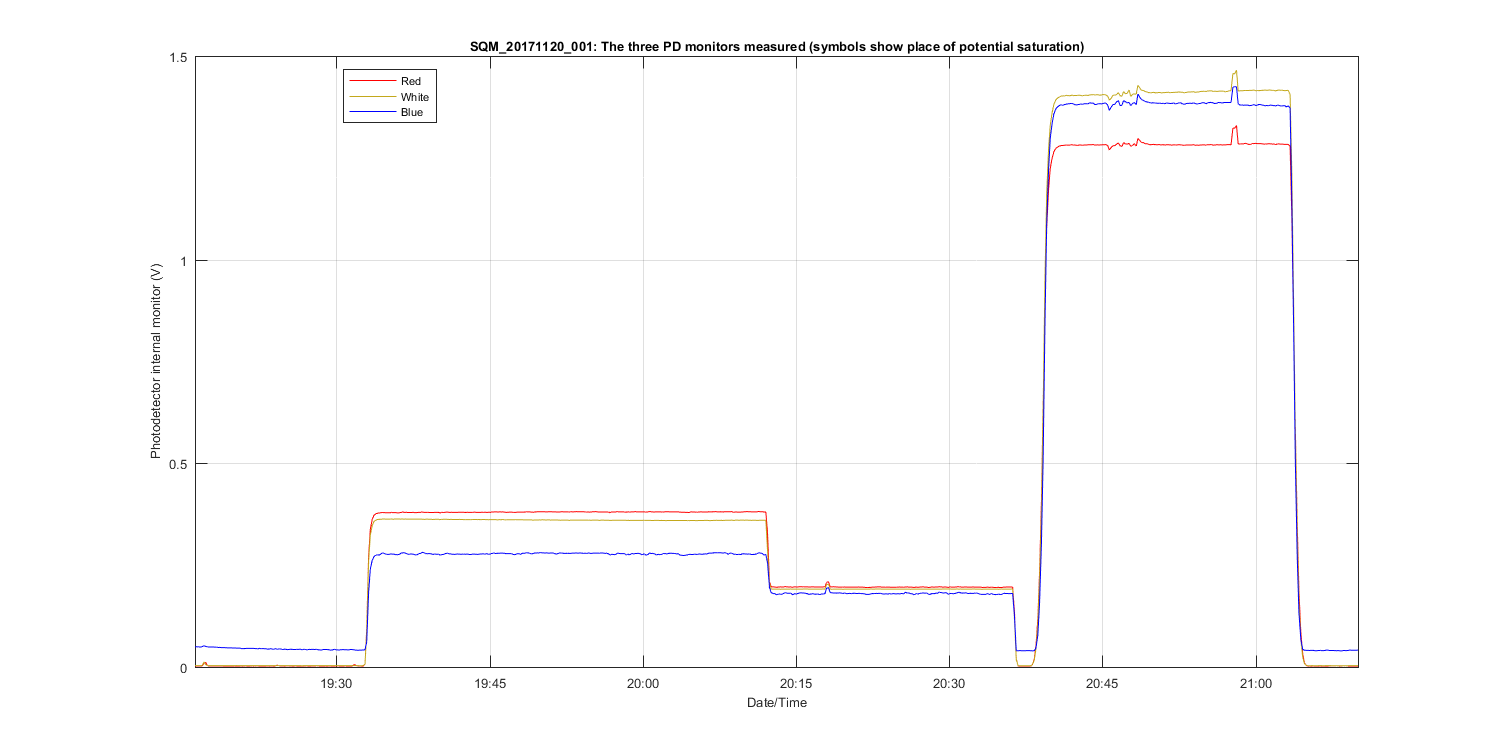
Figure 3
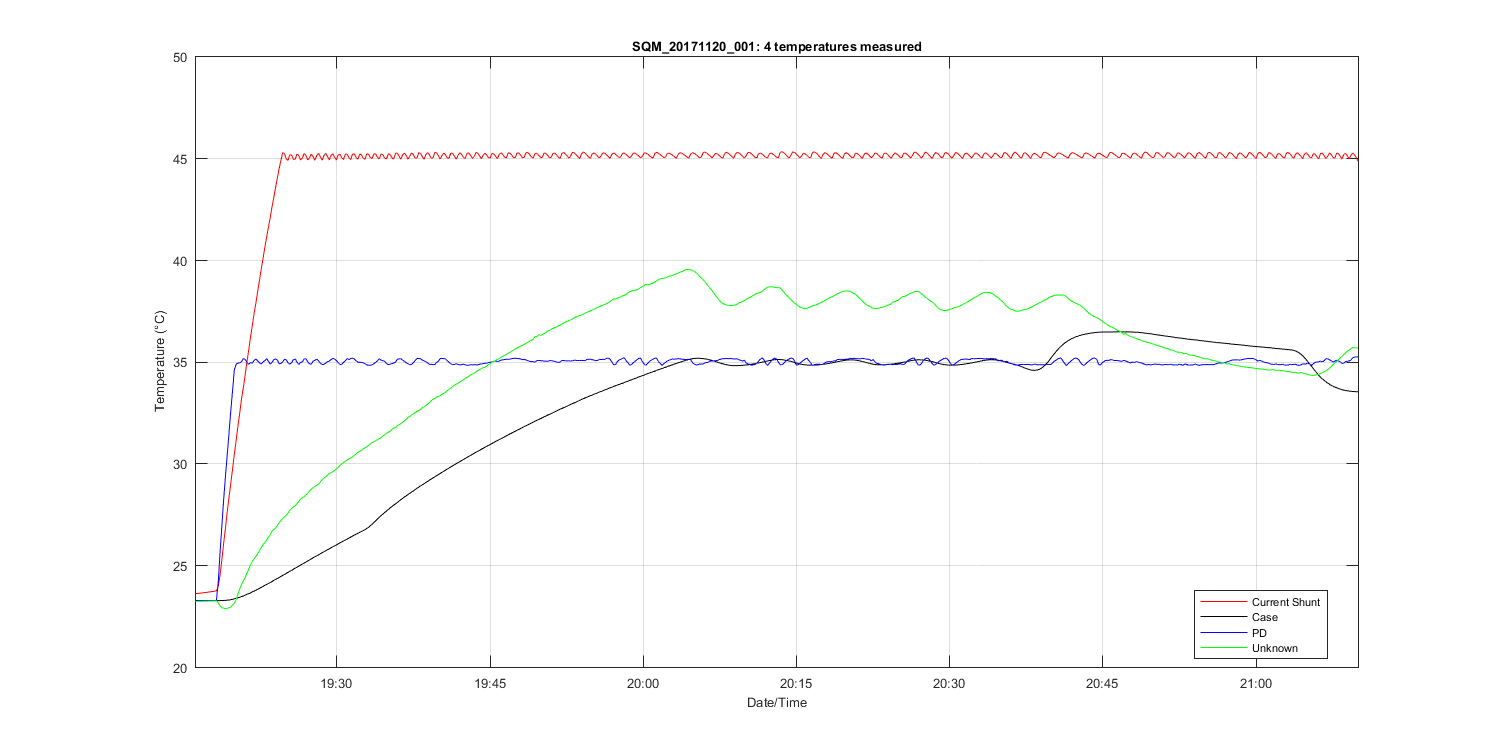
Figure 4
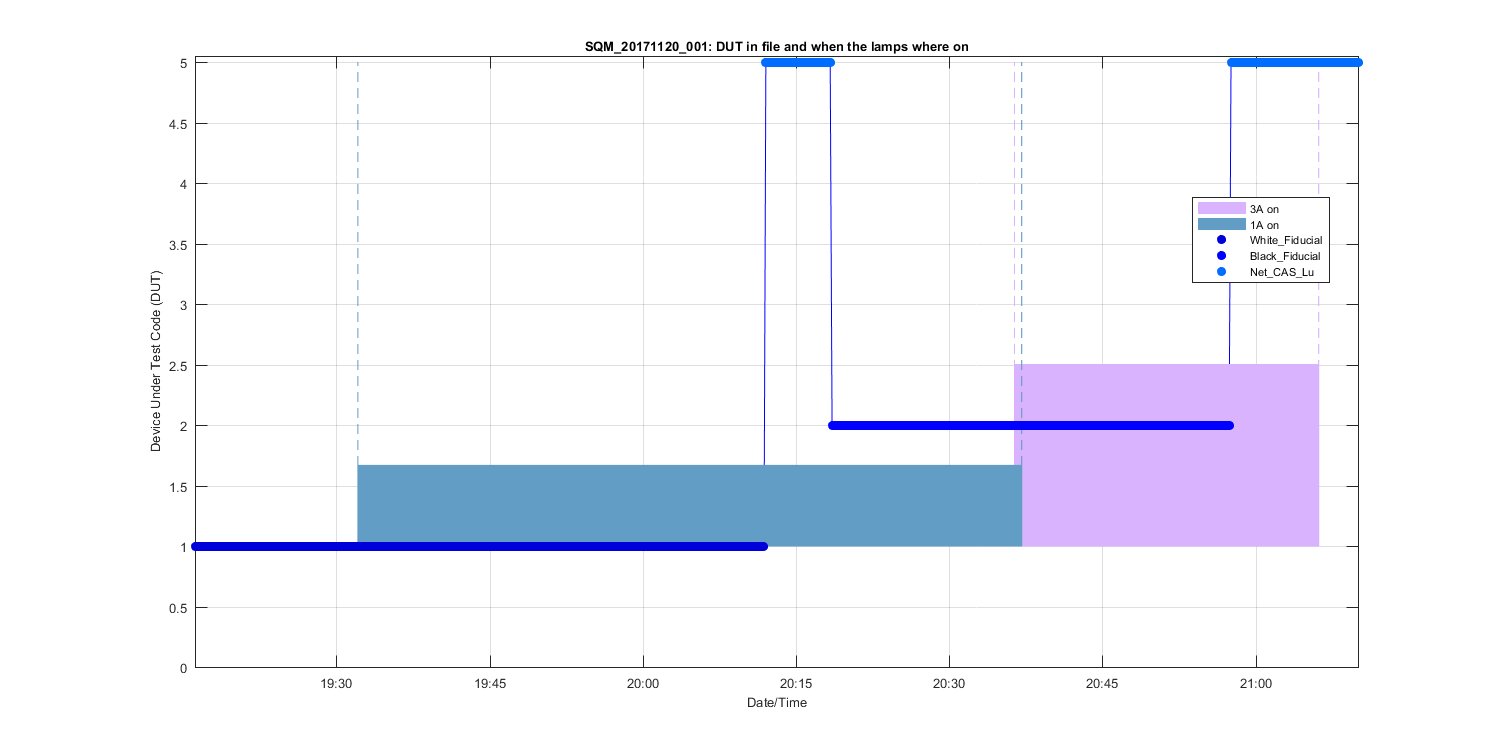
Figure 5
Figure 6
Figure 7
Figure 8
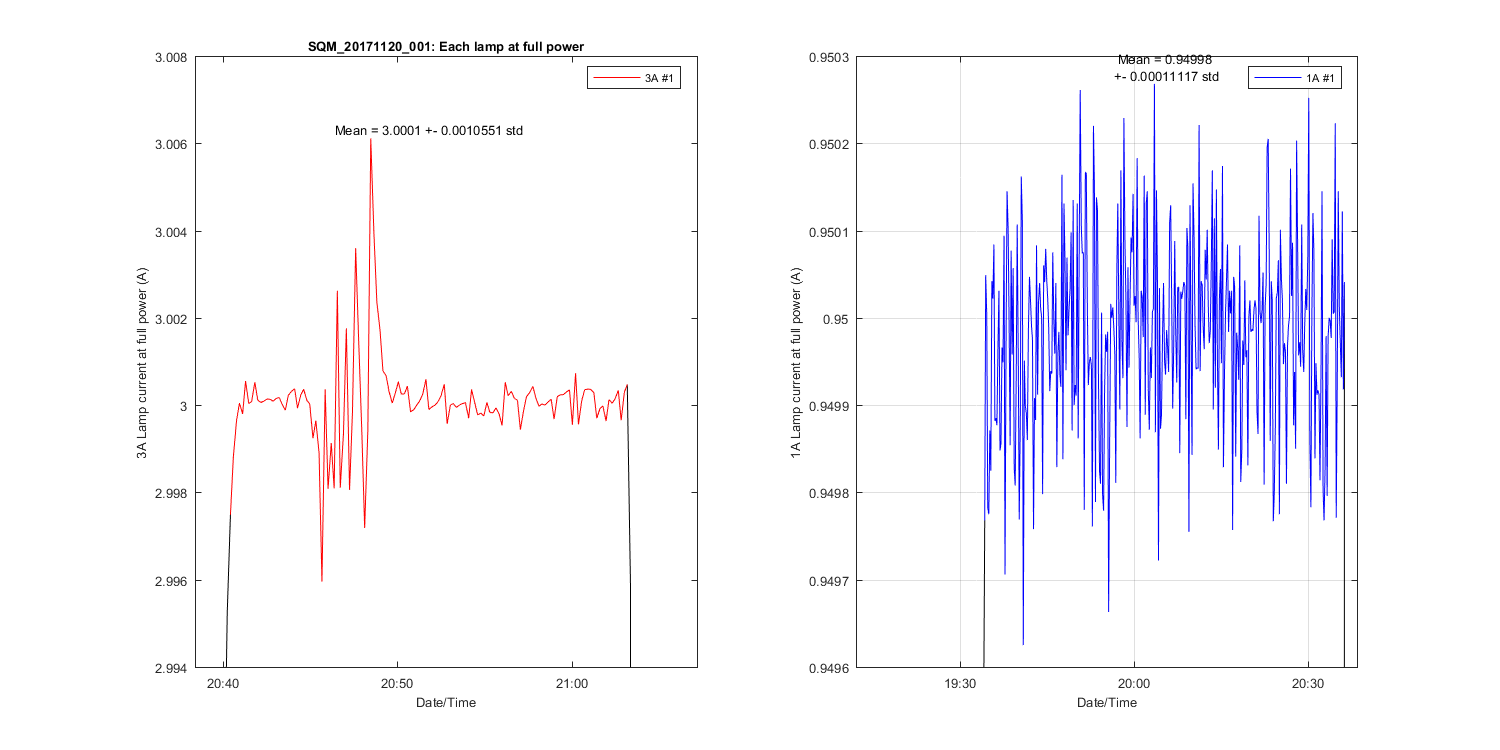
Figure 9
Figure 10