| Description | Value or Code |
|---|---|
| Cruise_Name:, Vaux(12,:) | NIST |
| Cruise_Number | 2017-003 |
| Investigator:: Vaux(16,:) | Ken Voss |
| Location_of_Measurement: Vaux(17,:) | KVoss Lab |
| Purpose: Vaux(18,:) | Stability Measurement |
| MOBY_NET_Sequence_Position: Vaux(20,:) | Calibration Facility |
| Ambient_Air_Temp (deg C) | 24.3 |
| Relative_Humidity (%) | 57 |
| #_of_Levels | 3 |
| Time_Step (sec) | 10 |
| Initial lamp state: Vaux(40,:) | All Off |
| Time_adjustment_to_GMT | 0 |
| Time_of_Last_Servicing | 20151218 |
| SQM_120VAC_On | 20171205.204000 |
| SQM_Off_to_Standby | 20171205.204355 |
| SQM_Standby_to_Off | 20171205.214126 |
| SQM_120VAC_Off | 20171205.214300 |
| Lamp 1 A burn hours | 0.48472 |
| Lamp 3 A burn hours | 0.44389 |
| DAQ_Program_Version | 19 |
| File Format Version | 2 |
| DAQ_Computer: Vaux(60,:) | EOS EQUIP 13 |
| DAQ_Program_Name: Vaux(61,:) | SQM Monitor_2.1.vi |
|
All Devices Under Test in the DUT column in DATA: DUT_White_Fiducial DUT_Black_Fiducial DUT_Net_CAS_Lu |
|
ASCII SQM file data: SQM_20171205_002.txt
ASCII SQM file data: PDF log file
| Lamp | On/Off # | N | Time on (hrs) | Mean (meas./set) | std | %std |
|---|---|---|---|---|---|---|
| Lamp 1A | 1 | 152 | 0.44111 | 0.94997 / 0.95 | 0.00012399 | 0.013052 |
| Lamp 3A | 1 | 112 | 0.32417 | 3.0001 / 3 | 0.00041349 | 0.013782 |
| Level | PD internal monitor (V) | Level Change # | Mean | std | %std |
|---|---|---|---|---|---|
| Low (1A) | Red | 1 | 0.27519 | 0.090913 | 33.0362 |
| Low (1A) | White | 1 | 0.26803 | 0.085785 | 33.9196 |
| Low (1A) | Blue | 1 | 0.22037 | 0.048614 | 41.254 |
| Medium (3A) | Red | 3 | 1.2855 | 0.0092889 | 0.72261 |
| Medium (3A) | White | 3 | 1.4203 | 0.010677 | 0.654 |
| Medium (3A) | Blue | 3 | 1.3716 | 0.011436 | 0.67722 |
| Level | Temperature (C) | Level Change # | Mean | std | %std |
|---|---|---|---|---|---|
| Low (1A) | PD | 1 | 34.9755 | 0.10856 | 0.31039 |
| Medium (3A) | PD | 3 | 35.0449 | 0.096966 | 0.27669 |
Red PD (max value): 1.3388: #of possible satureated values 0
White PD (max value): 1.4709: #of possible satureated values 0
Blue PD (max value): 1.4338: #of possible satureated values 0
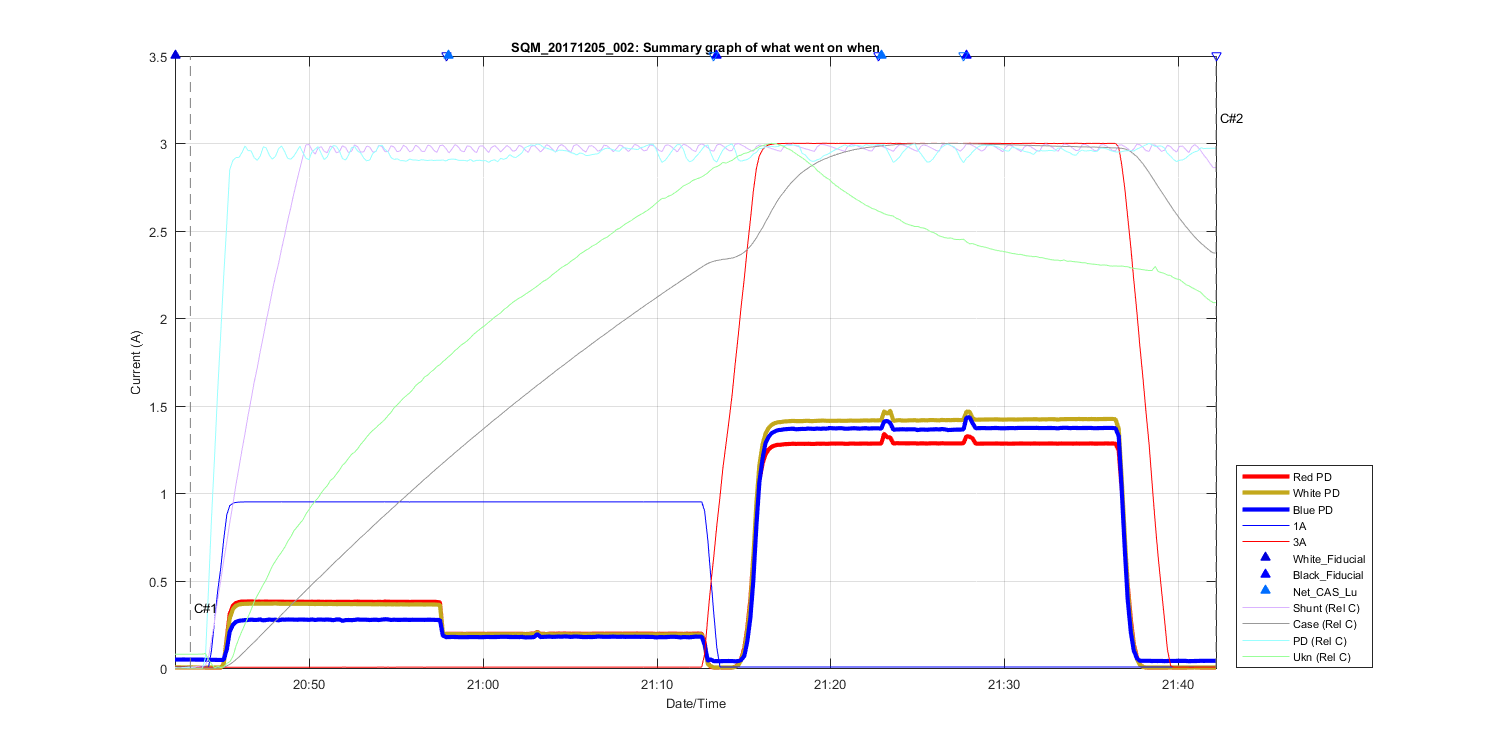
Figure 1
Summary Graph showing all measurements taken in this file, including auxilliary temperature measurements and comments. The text C# shows what time in the file the comments (shown above where made). The triangles at the top of the figure shows then a DUT (Device under test) was placed in front of the SQM and removed.
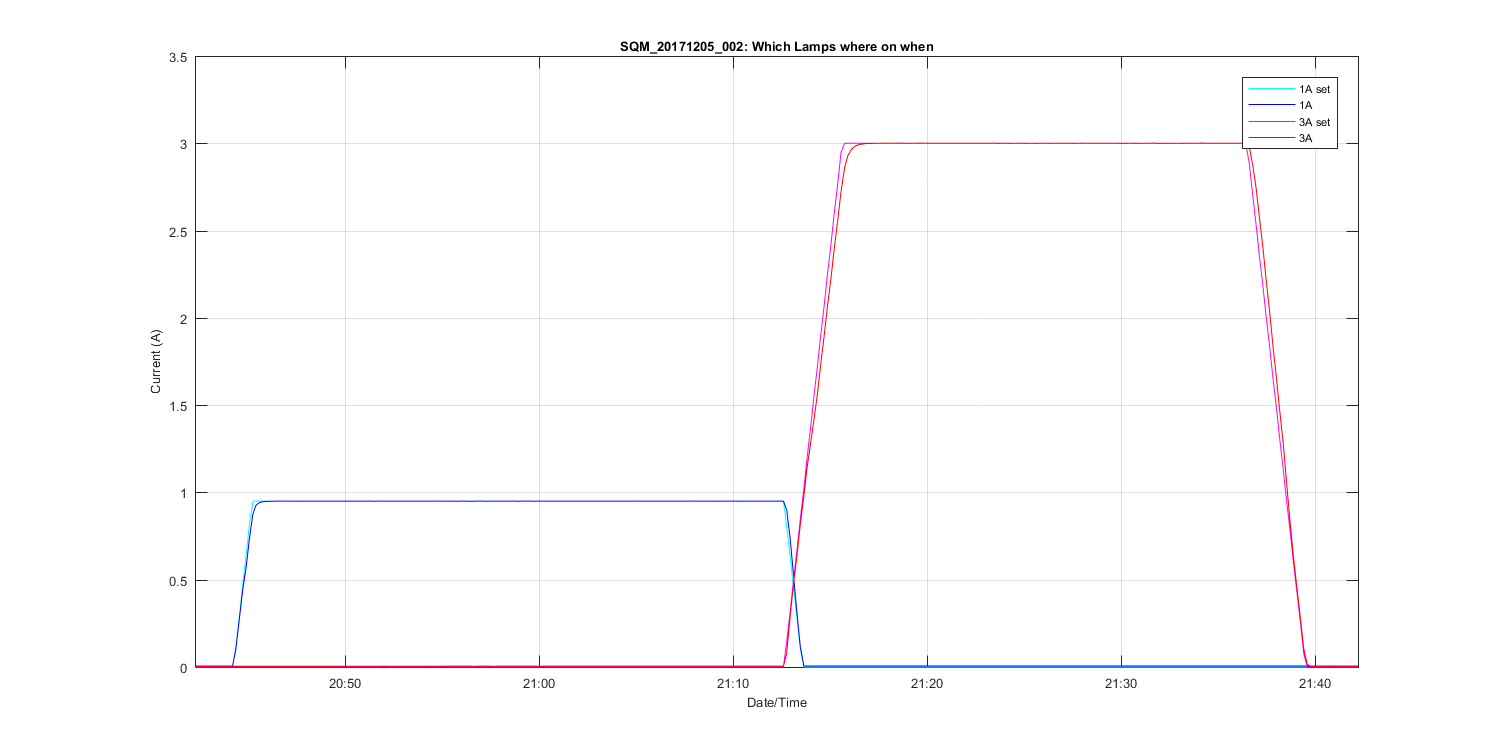
Figure 2
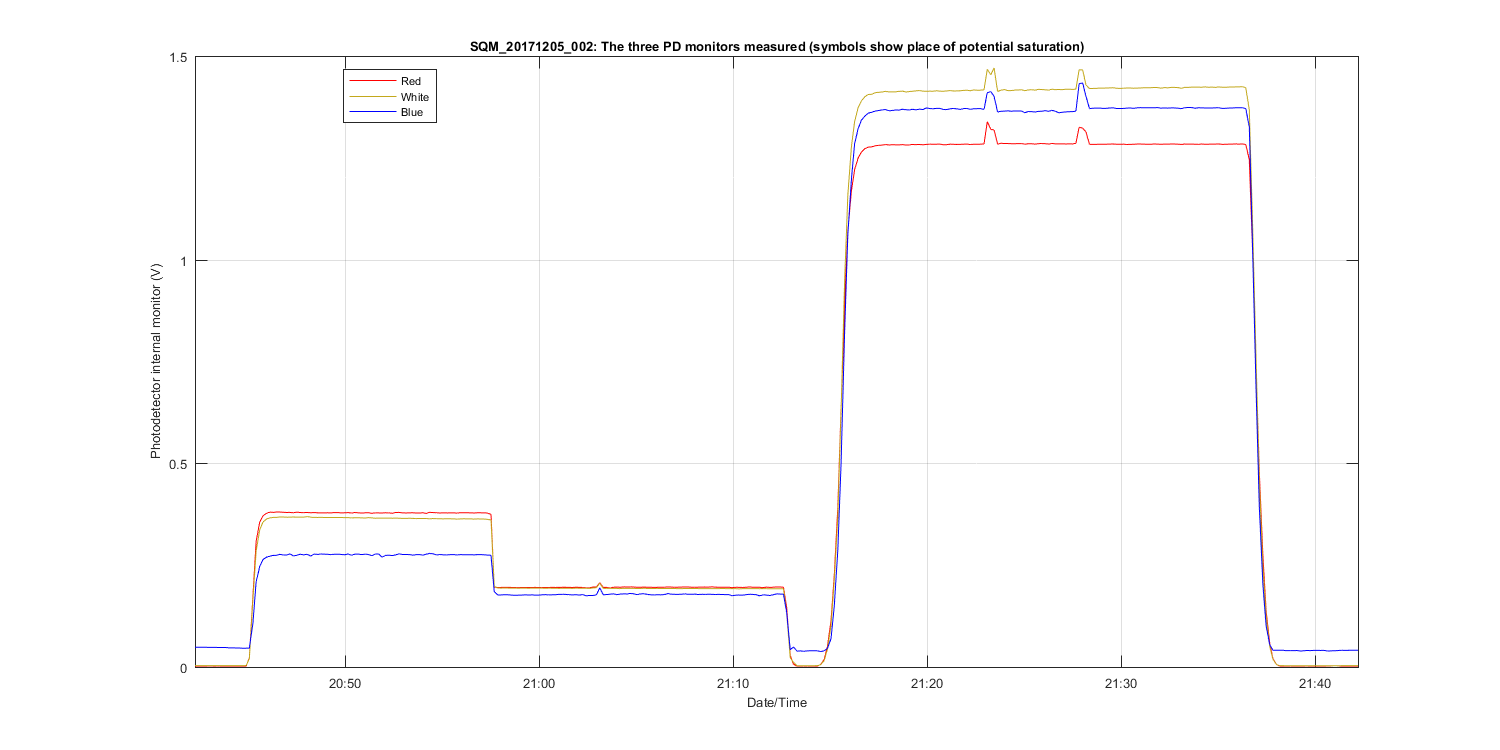
Figure 3
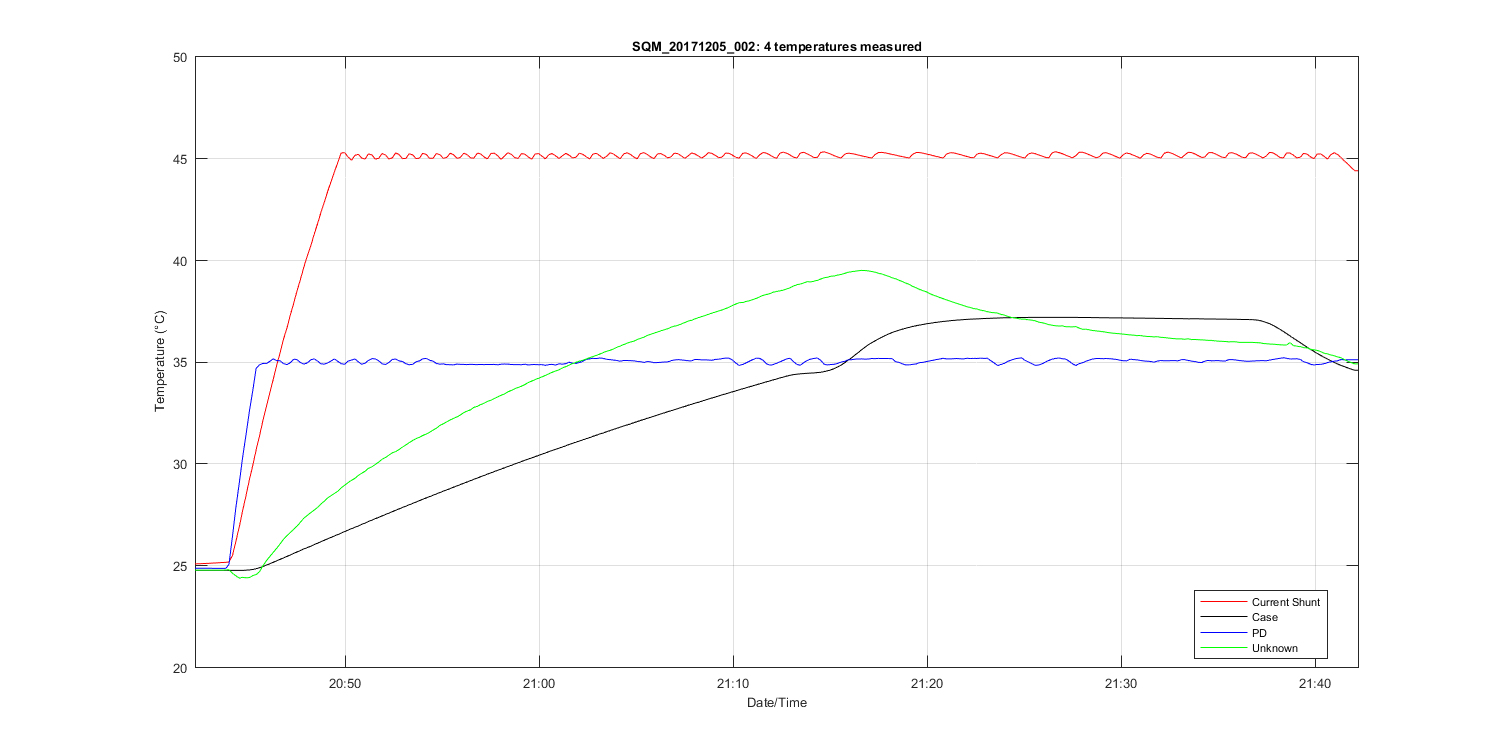
Figure 4
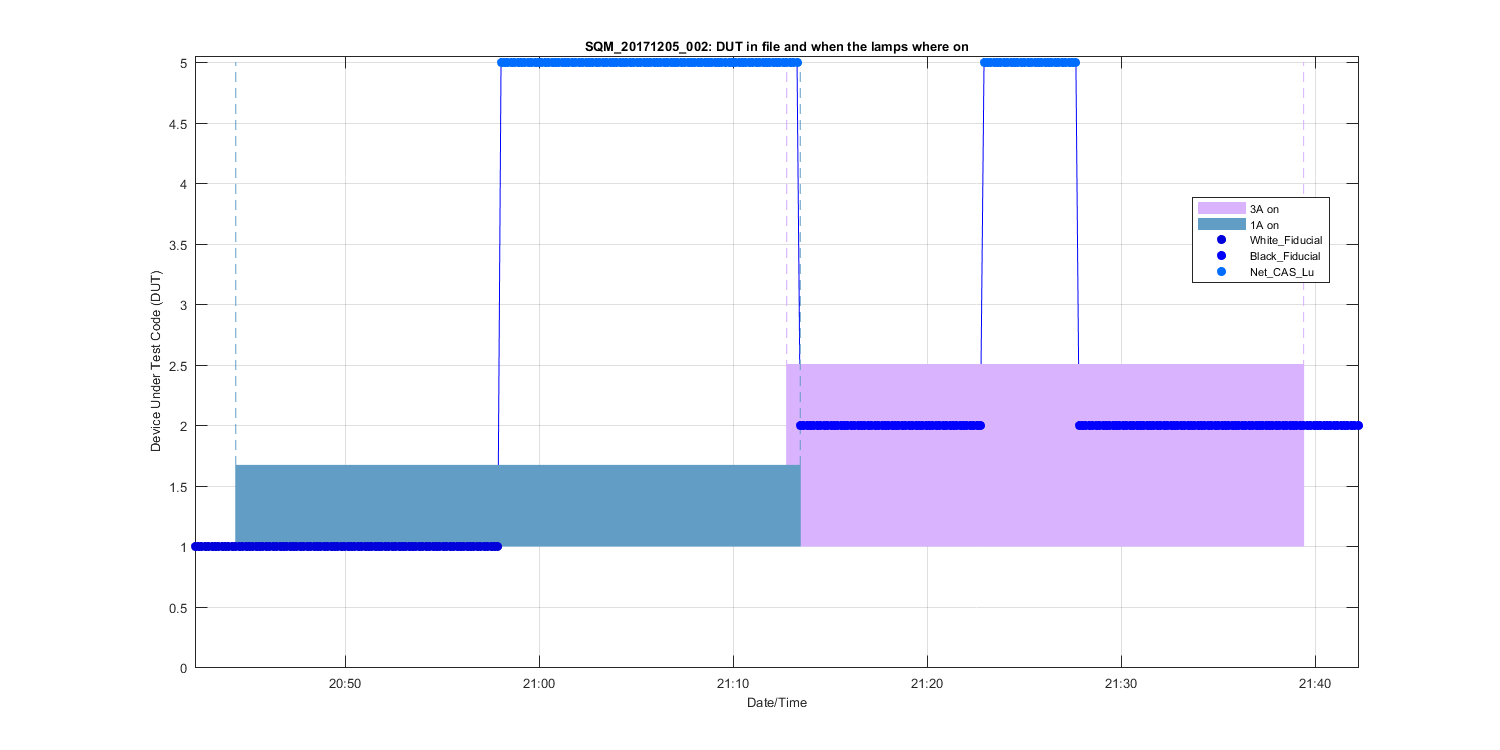
Figure 5
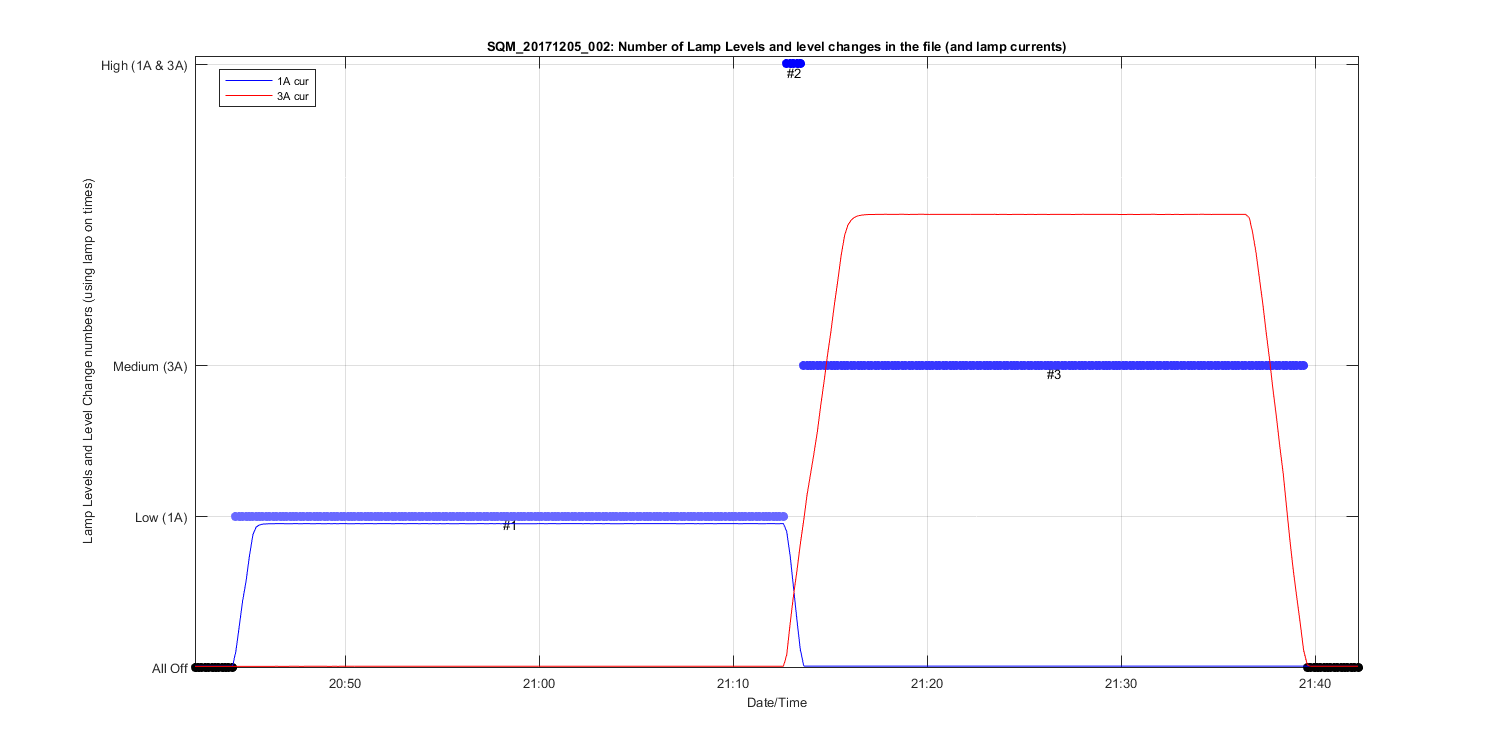
Figure 6
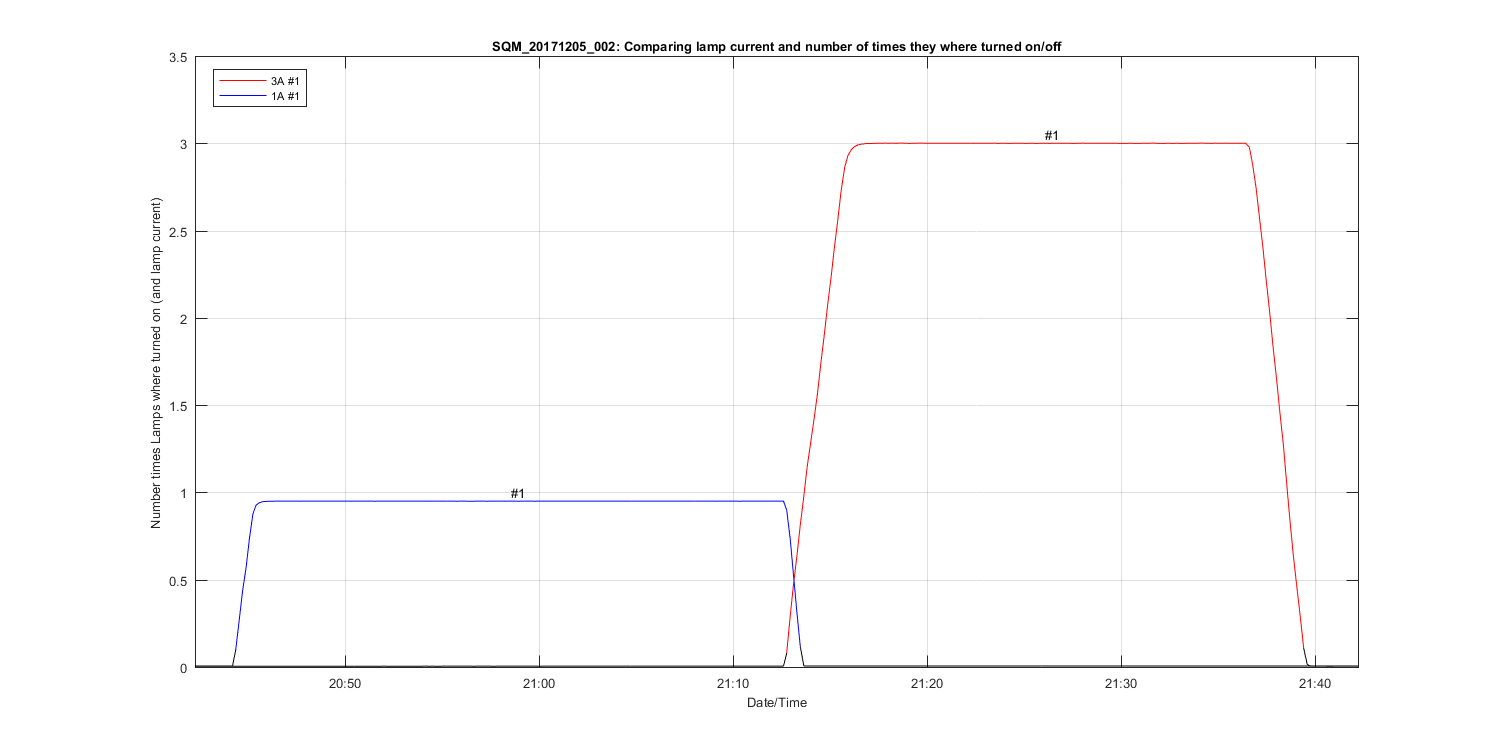
Figure 7
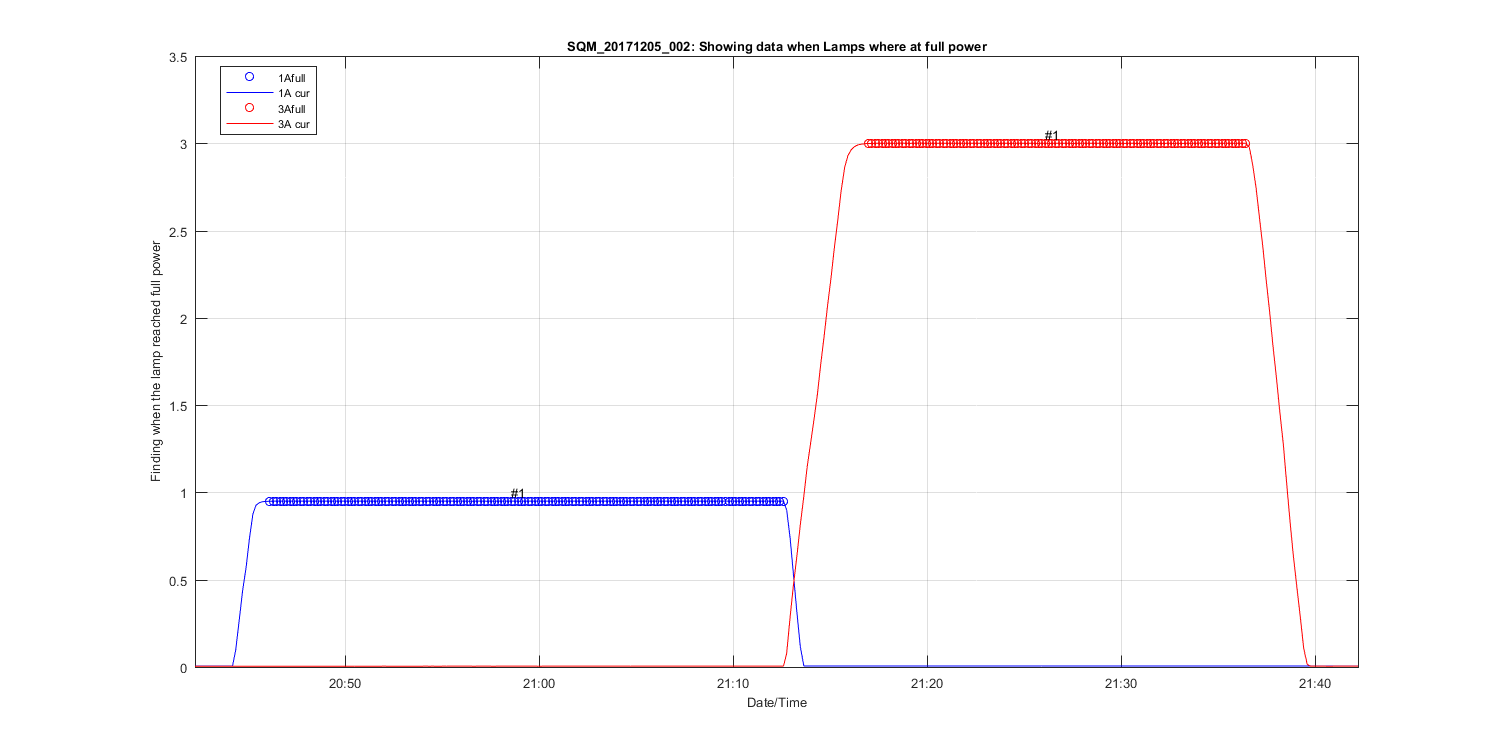
Figure 8
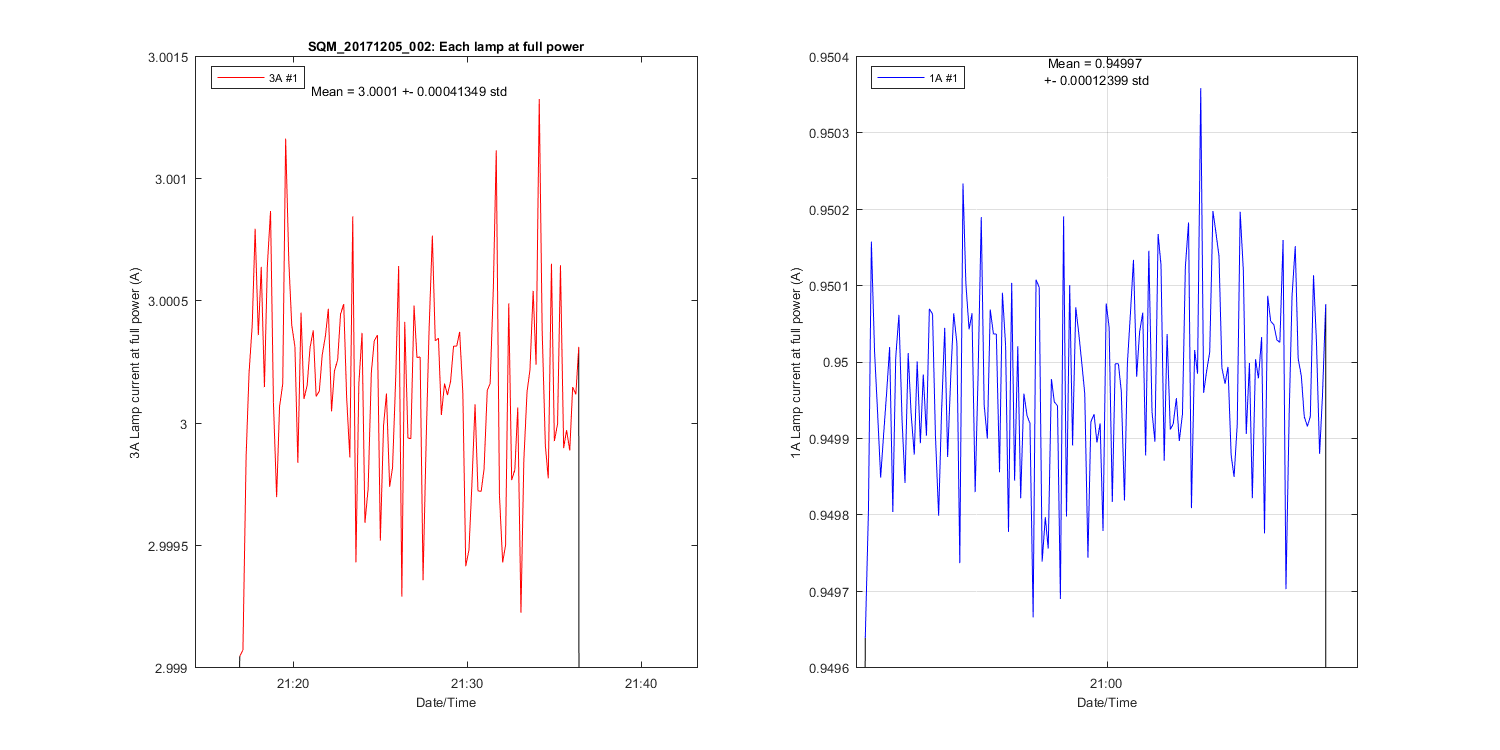
Figure 9
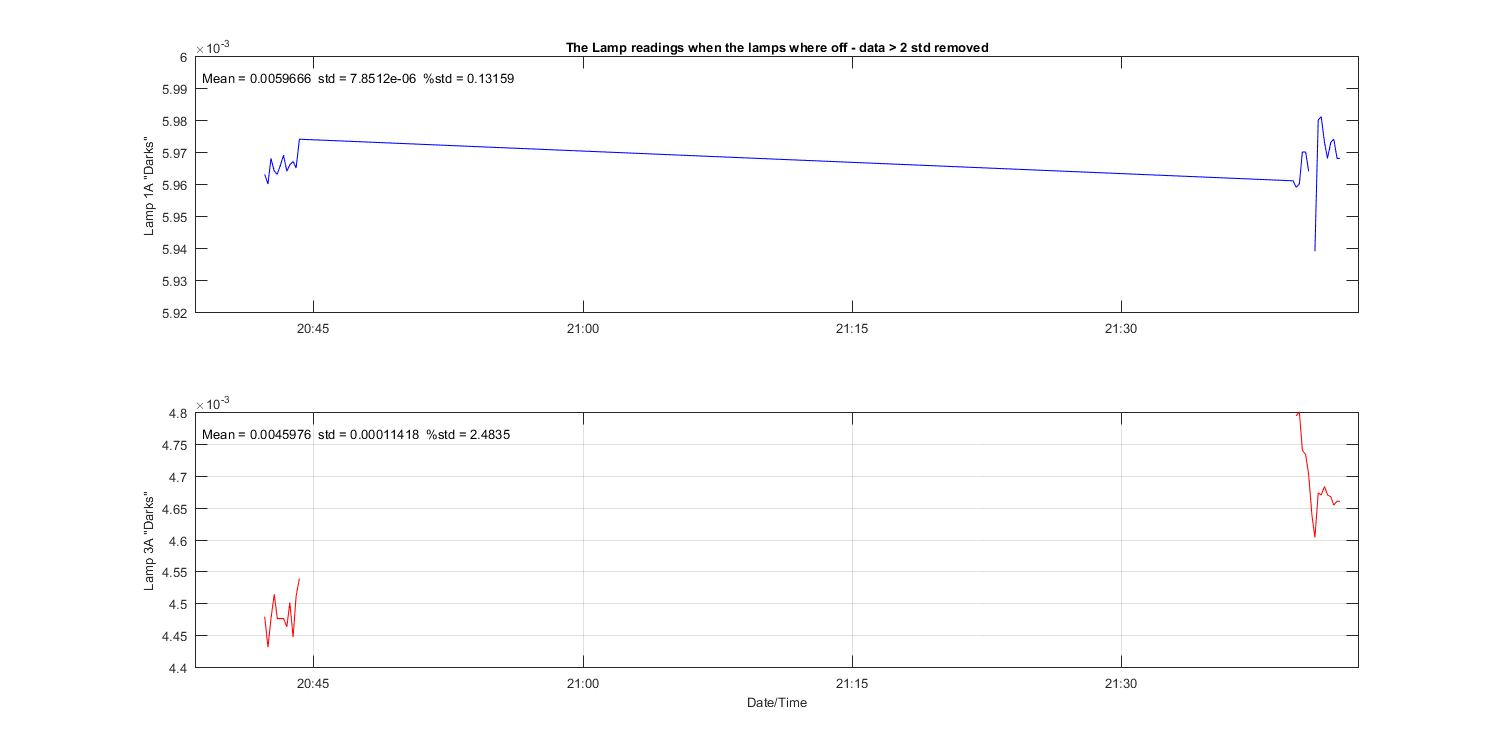
Figure 10