| Description | Value or Code |
|---|---|
| Cruise_Name:, Vaux(12,:) | NIST |
| Cruise_Number | 2017-003 |
| Investigator:: Vaux(16,:) | Ken Voss |
| Location_of_Measurement: Vaux(17,:) | KVoss Lab |
| Purpose: Vaux(18,:) | Stability Measurement |
| MOBY_NET_Sequence_Position: Vaux(20,:) | Calibration Facility |
| Ambient_Air_Temp (deg C) | 25.7 |
| Relative_Humidity (%) | 69 |
| #_of_Levels | 3 |
| Time_Step (sec) | 10 |
| Initial lamp state: Vaux(40,:) | All Off |
| Time_adjustment_to_GMT | 0 |
| Time_of_Last_Servicing | 20151218 |
| SQM_120VAC_On | 20171206.154000 |
| SQM_Off_to_Standby | 20171206.154349 |
| SQM_Standby_to_Off | 20171206.163440 |
| SQM_120VAC_Off | 20171206.163600 |
| Lamp 1 A burn hours | 0.48472 |
| Lamp 3 A burn hours | 0.35611 |
| DAQ_Program_Version | 19 |
| File Format Version | 2 |
| DAQ_Computer: Vaux(60,:) | EOS EQUIP 13 |
| DAQ_Program_Name: Vaux(61,:) | SQM Monitor_2.1.vi |
|
All Devices Under Test in the DUT column in DATA: DUT_White_Fiducial DUT_Black_Fiducial DUT_Net_CAS_Lu |
|
ASCII SQM file data: SQM_20171206_002.txt
ASCII SQM file data: PDF log file
| Lamp | On/Off # | N | Time on (hrs) | Mean (meas./set) | std | %std |
|---|---|---|---|---|---|---|
| Lamp 1A | 1 | 151 | 0.43806 | 0.94997 / 0.95 | 0.00013993 | 0.01473 |
| Lamp 3A | 1 | 82 | 0.23667 | 3.0001 / 3 | 0.00032434 | 0.010811 |
| Level | PD internal monitor (V) | Level Change # | Mean | std | %std |
|---|---|---|---|---|---|
| Low (1A) | Red | 1 | 0.30256 | 0.090217 | 29.8181 |
| Low (1A) | White | 1 | 0.29447 | 0.08483 | 30.6368 |
| Low (1A) | Blue | 1 | 0.23649 | 0.049706 | 38.1482 |
| Medium (3A) | Red | 3 | 1.2863 | 0.017773 | 1.3817 |
| Medium (3A) | White | 3 | 1.422 | 0.035814 | 1.2498 |
| Medium (3A) | Blue | 3 | 1.3798 | 0.073894 | 1.2881 |
| Level | Temperature (C) | Level Change # | Mean | std | %std |
|---|---|---|---|---|---|
| Low (1A) | PD | 1 | 34.9687 | 0.10451 | 0.29886 |
| Medium (3A) | PD | 3 | 35.0201 | 0.10397 | 0.2969 |
Red PD (max value): 1.3797: #of possible satureated values 0
White PD (max value): 1.6454: #of possible satureated values 0
Blue PD (max value): 1.9449: #of possible satureated values 0
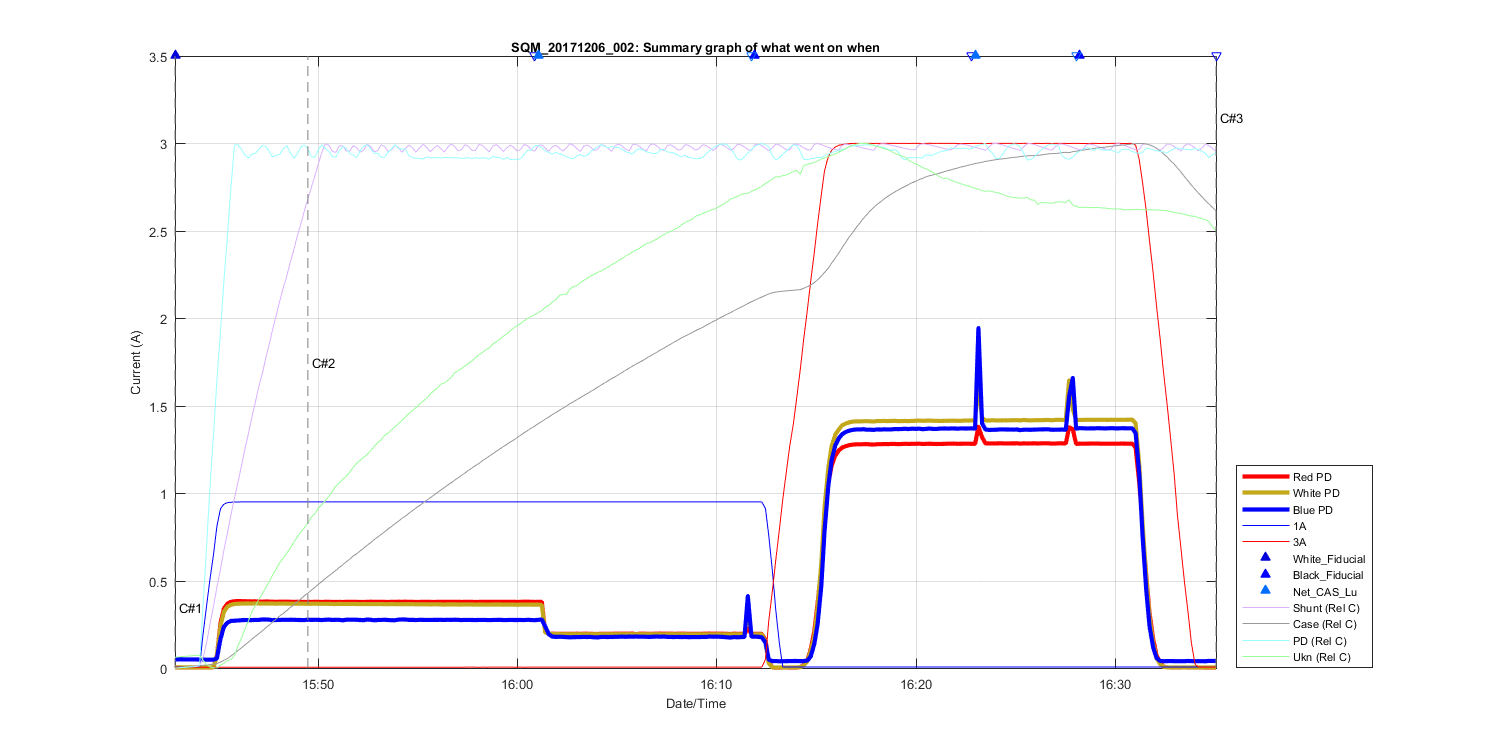
Figure 1
Summary Graph showing all measurements taken in this file, including auxilliary temperature measurements and comments. The text C# shows what time in the file the comments (shown above where made). The triangles at the top of the figure shows then a DUT (Device under test) was placed in front of the SQM and removed.
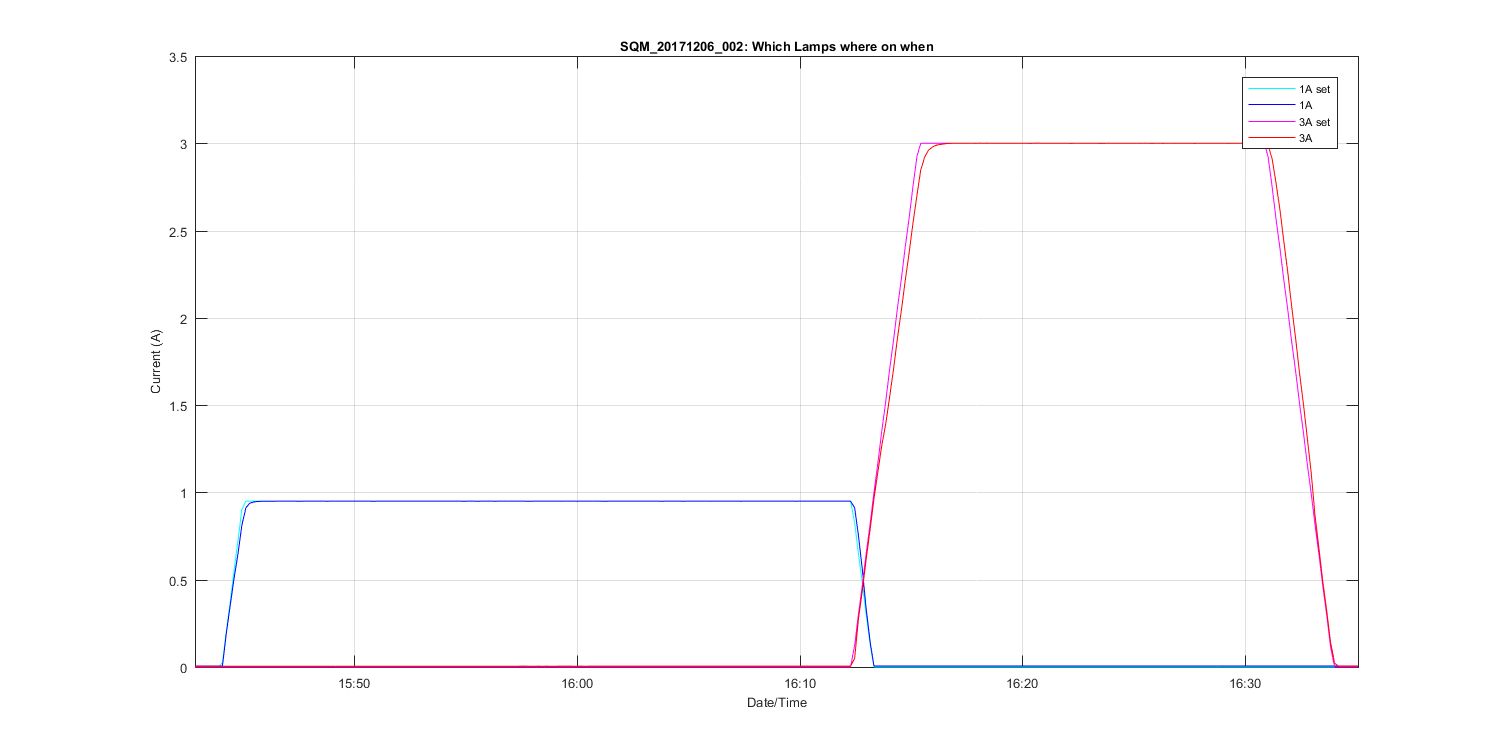
Figure 2
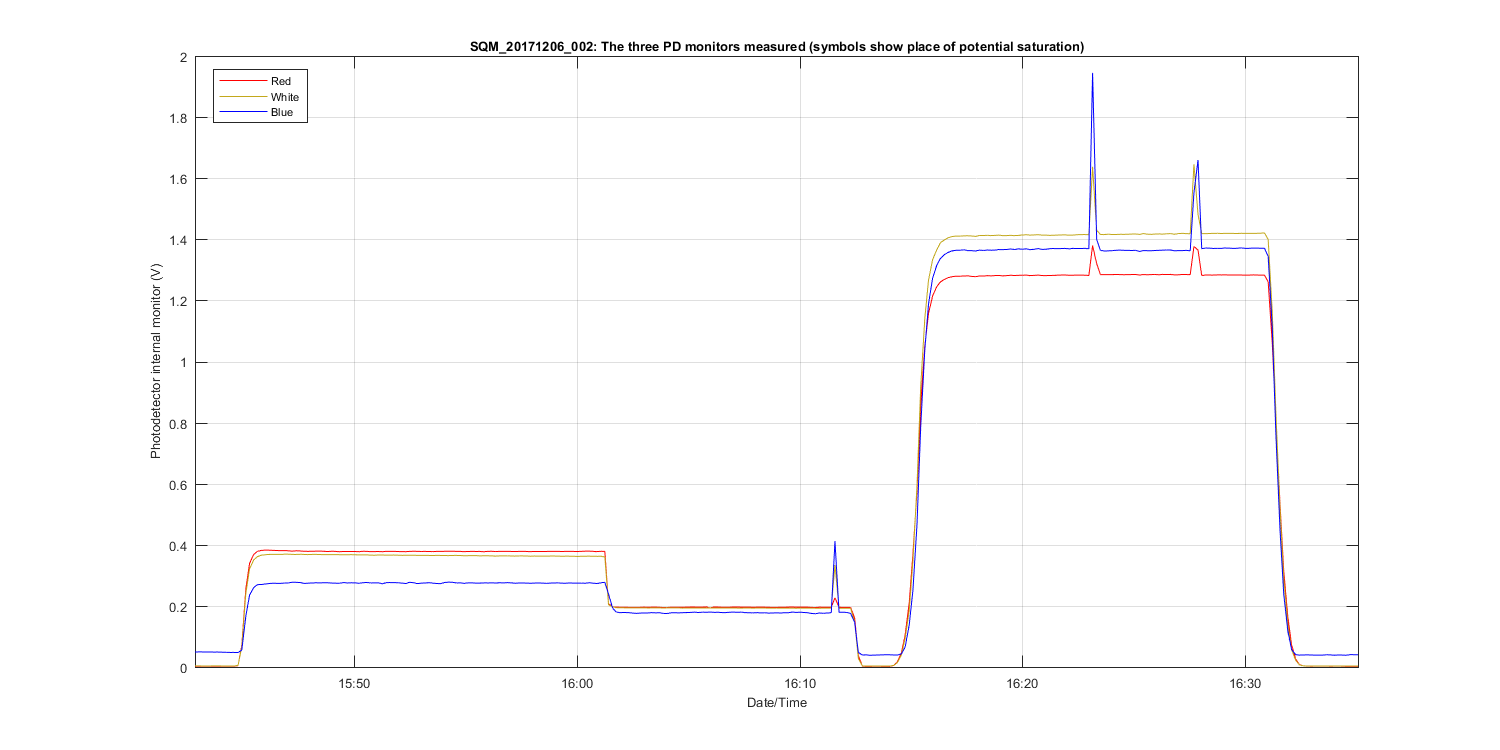
Figure 3
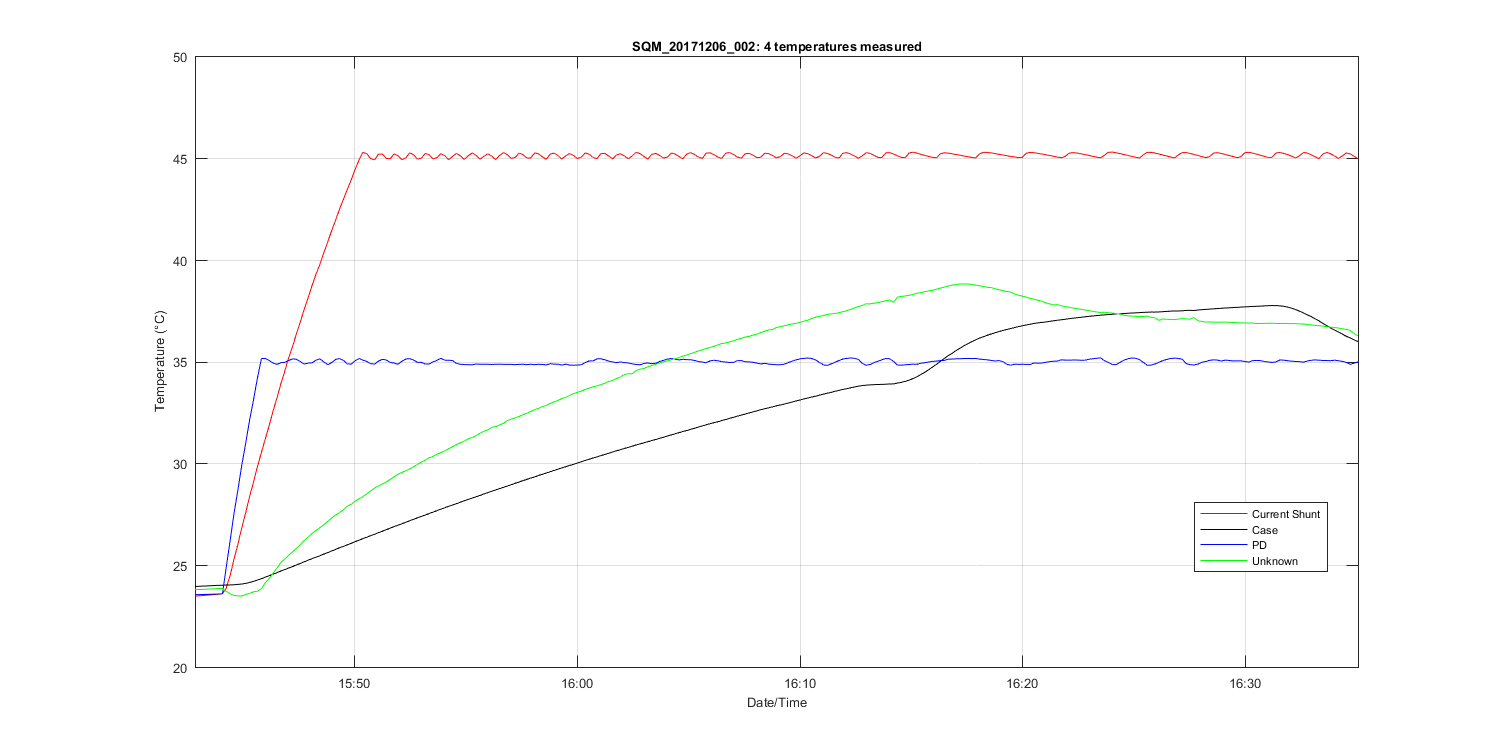
Figure 4
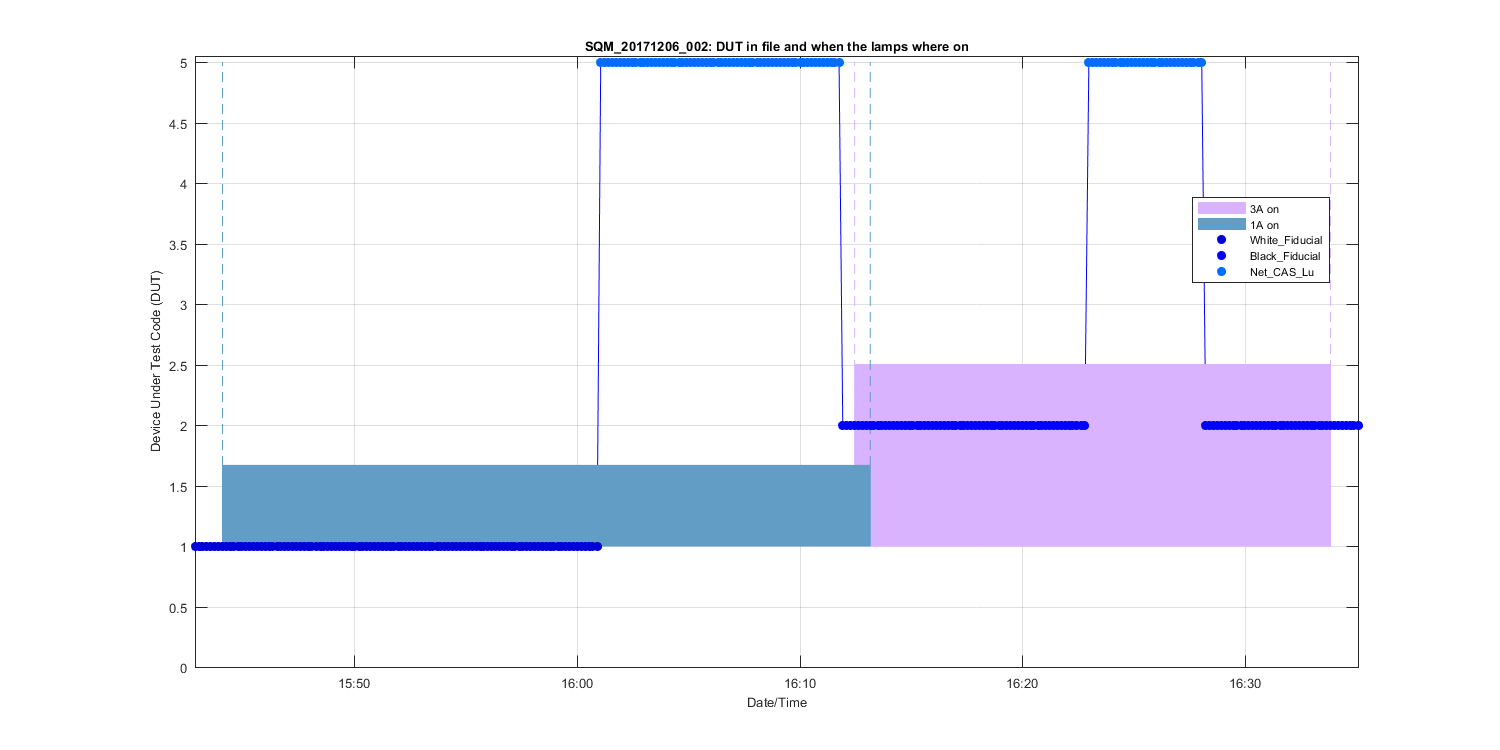
Figure 5
Figure 6
Figure 7
Figure 8
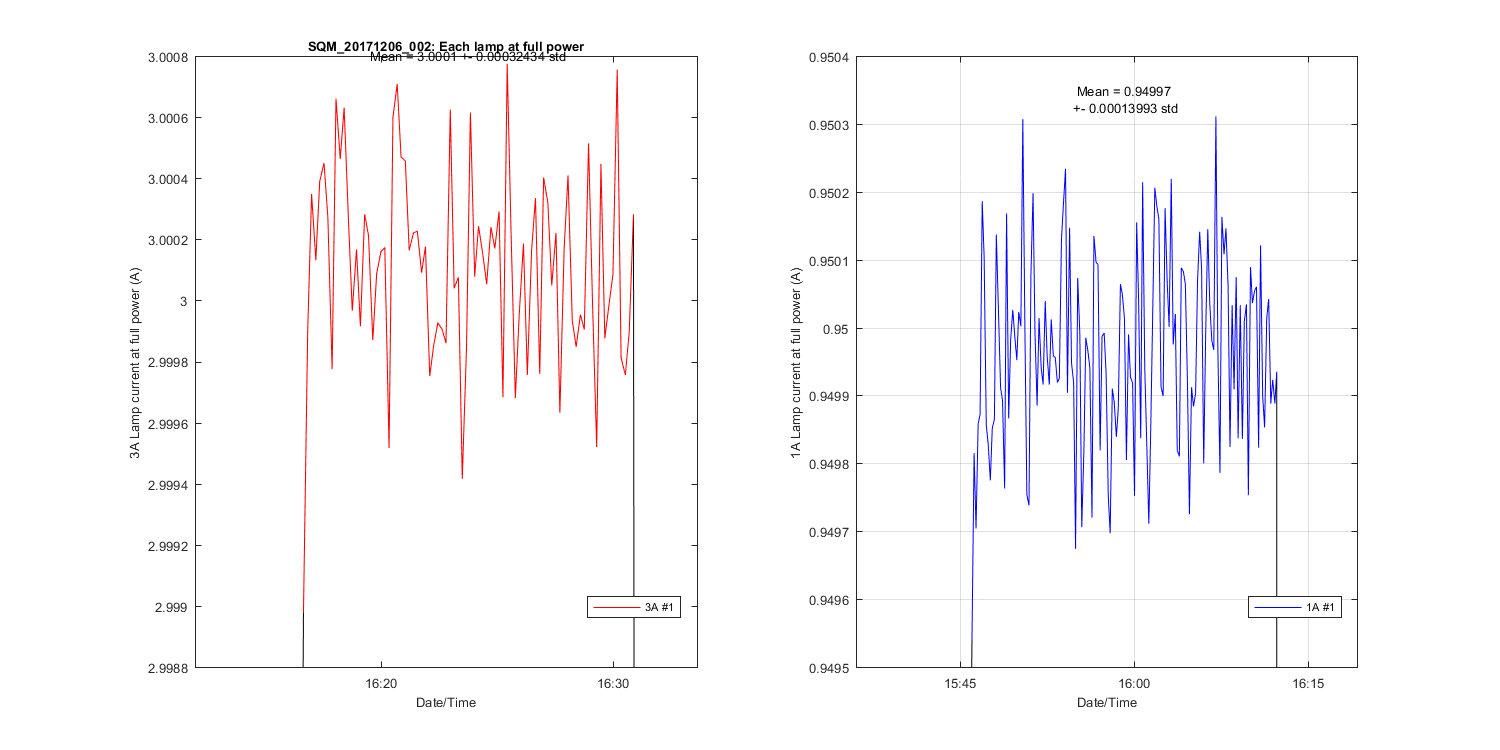
Figure 9
Figure 10