| Description | Value or Code |
|---|---|
| Cruise_Name:, Vaux(12,:) | NIST |
| Cruise_Number | 2018-001 |
| Investigator:: Vaux(16,:) | Carol Johnson |
| Location_of_Measurement: Vaux(17,:) | NIST B019_221 |
| Purpose: Vaux(18,:) | Stability Measurement |
| MOBY_NET_Sequence_Position: Vaux(20,:) | Calibration Facility |
| Ambient_Air_Temp (deg C) | 23.1 |
| Relative_Humidity (%) | 16 |
| #_of_Levels | 3 |
| Time_Step (sec) | 10 |
| Initial lamp state: Vaux(40,:) | All Off |
| Time_adjustment_to_GMT | 0 |
| Time_of_Last_Servicing | 20151218 |
| SQM_120VAC_On | 20180117.175200 |
| SQM_Off_to_Standby | 20180117.180338 |
| SQM_Standby_to_Off | 20180117.192824 |
| SQM_120VAC_Off | 20180117.193000 |
| Lamp 1 A burn hours | 0.54611 |
| Lamp 3 A burn hours | 0.68639 |
| DAQ_Program_Version | 19 |
| File Format Version | 2 |
| DAQ_Computer: Vaux(60,:) | EOS EQUIP 13 |
| DAQ_Program_Name: Vaux(61,:) | SQM Monitor_2.1.vi |
|
All Devices Under Test in the DUT column in DATA: DUT_White_Fiducial DUT_Black_Fiducial DUT_Net_CAS_Lu DUT_VXR |
|
ASCII SQM file data: SQM_20180117_001.txt
ASCII SQM file data: PDF log file
| Lamp | On/Off # | N | Time on (hrs) | Mean (meas./set) | std | %std |
|---|---|---|---|---|---|---|
| Lamp 1A | 1 | 172 | 0.49944 | 0.94997 / 0.95 | 0.00012713 | 0.013383 |
| Lamp 3A | 1 | 197 | 0.57222 | 2.9999 / 3 | 0.002001 | 0.066702 |
| Level | PD internal monitor (V) | Level Change # | Mean | std | %std |
|---|---|---|---|---|---|
| Low (1A) | Red | 1 | 0.24528 | 0.076975 | 31.3823 |
| Low (1A) | White | 1 | 0.2411 | 0.072782 | 31.9262 |
| Low (1A) | Blue | 1 | 0.20574 | 0.039822 | 37.4143 |
| Medium (3A) | Red | 3 | 1.297 | 0.019128 | 1.4747 |
| Medium (3A) | White | 3 | 1.435 | 0.022952 | 1.3329 |
| Medium (3A) | Blue | 3 | 1.377 | 0.019018 | 1.389 |
| Level | Temperature (C) | Level Change # | Mean | std | %std |
|---|---|---|---|---|---|
| Low (1A) | PD | 1 | 34.9654 | 0.10819 | 0.30943 |
| Medium (3A) | PD | 3 | 35.0032 | 0.12352 | 0.35289 |
Red PD (max value): 1.3379: #of possible satureated values 0
White PD (max value): 1.4794: #of possible satureated values 0
Blue PD (max value): 1.414: #of possible satureated values 0
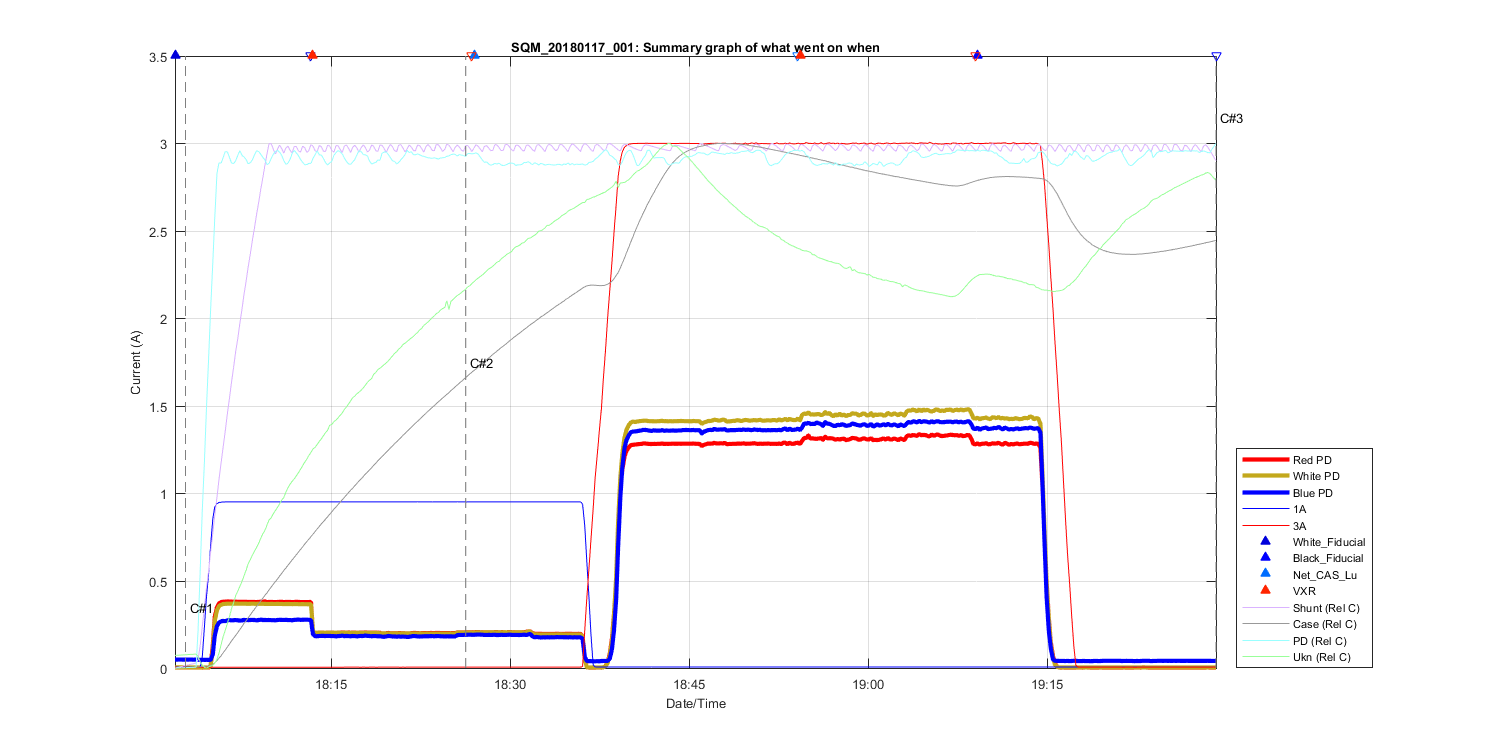
Figure 1
Summary Graph showing all measurements taken in this file, including auxilliary temperature measurements and comments. The text C# shows what time in the file the comments (shown above where made). The triangles at the top of the figure shows then a DUT (Device under test) was placed in front of the SQM and removed.
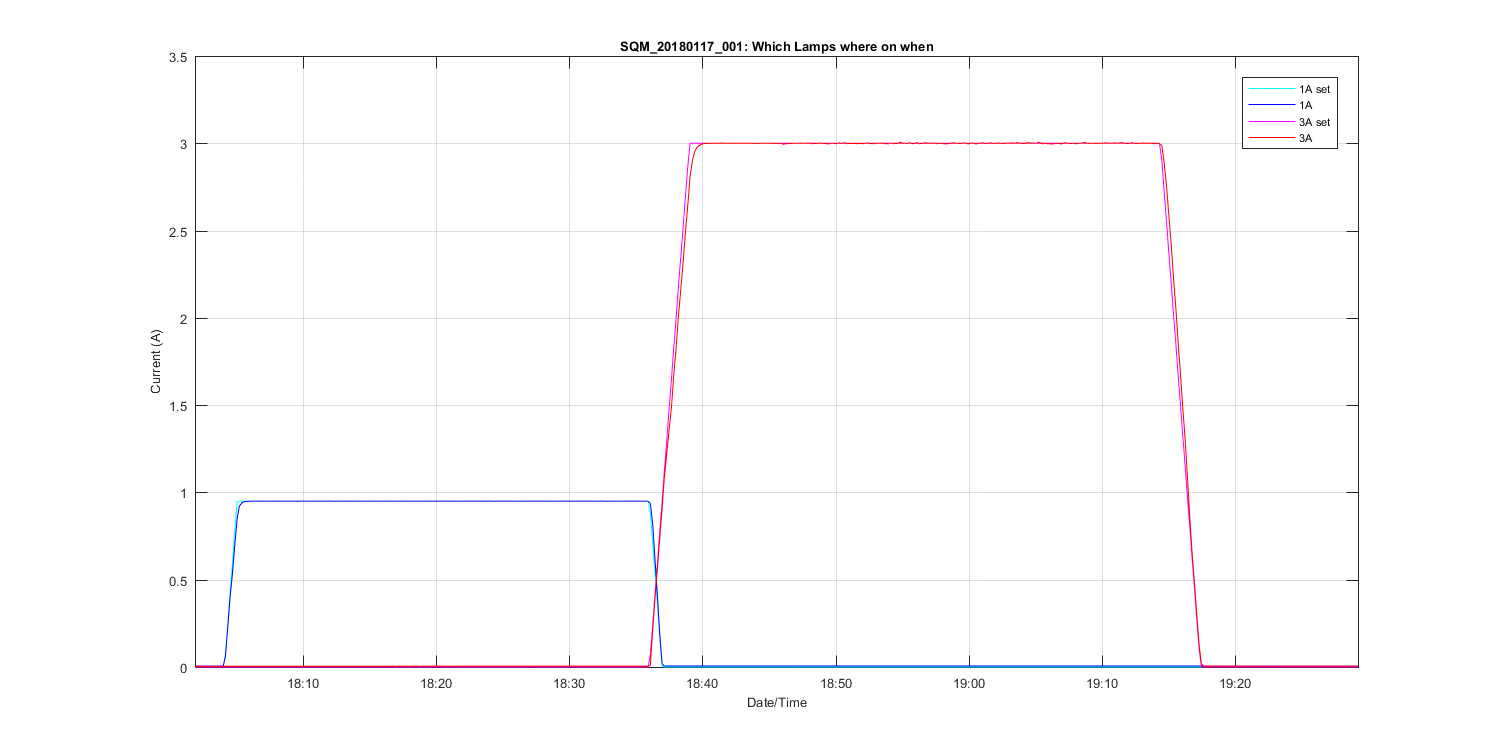
Figure 2
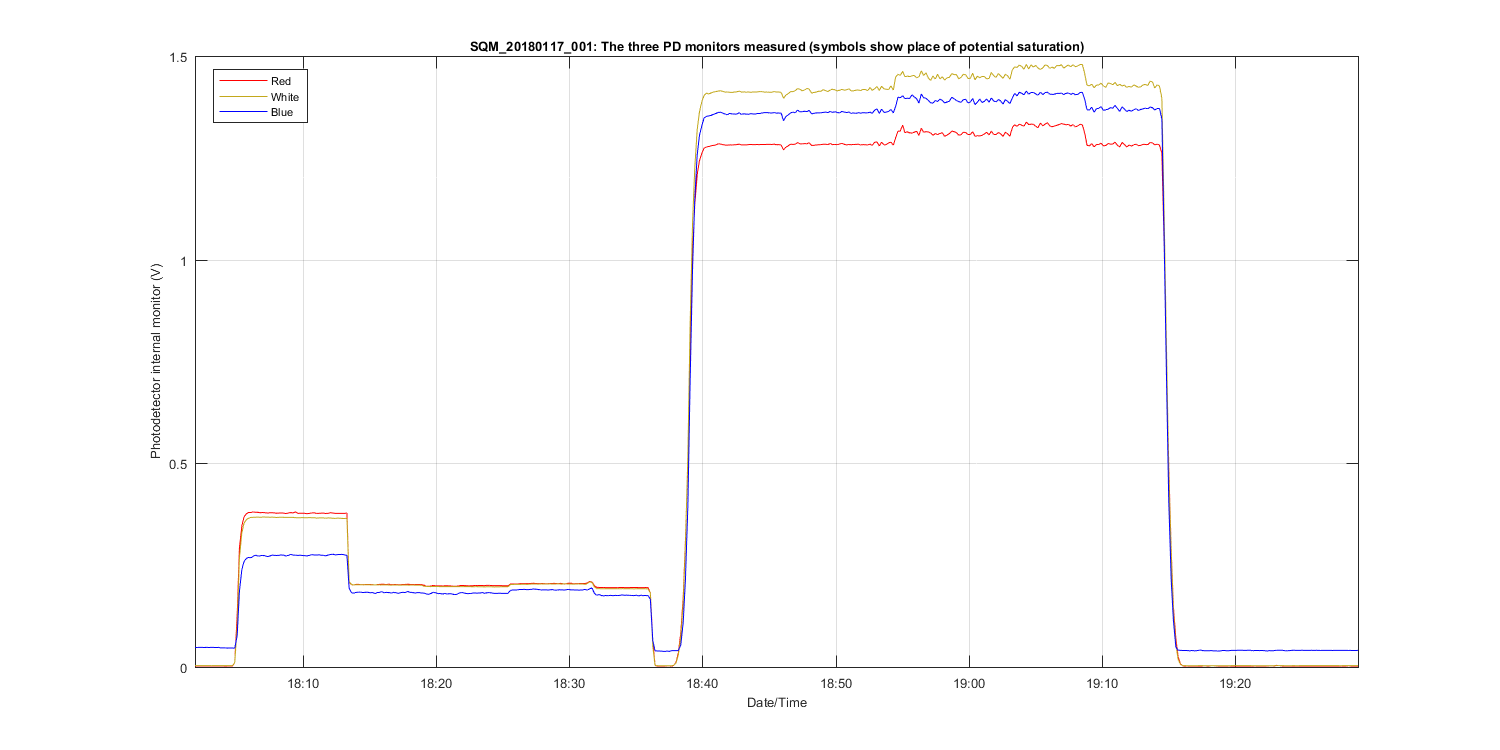
Figure 3
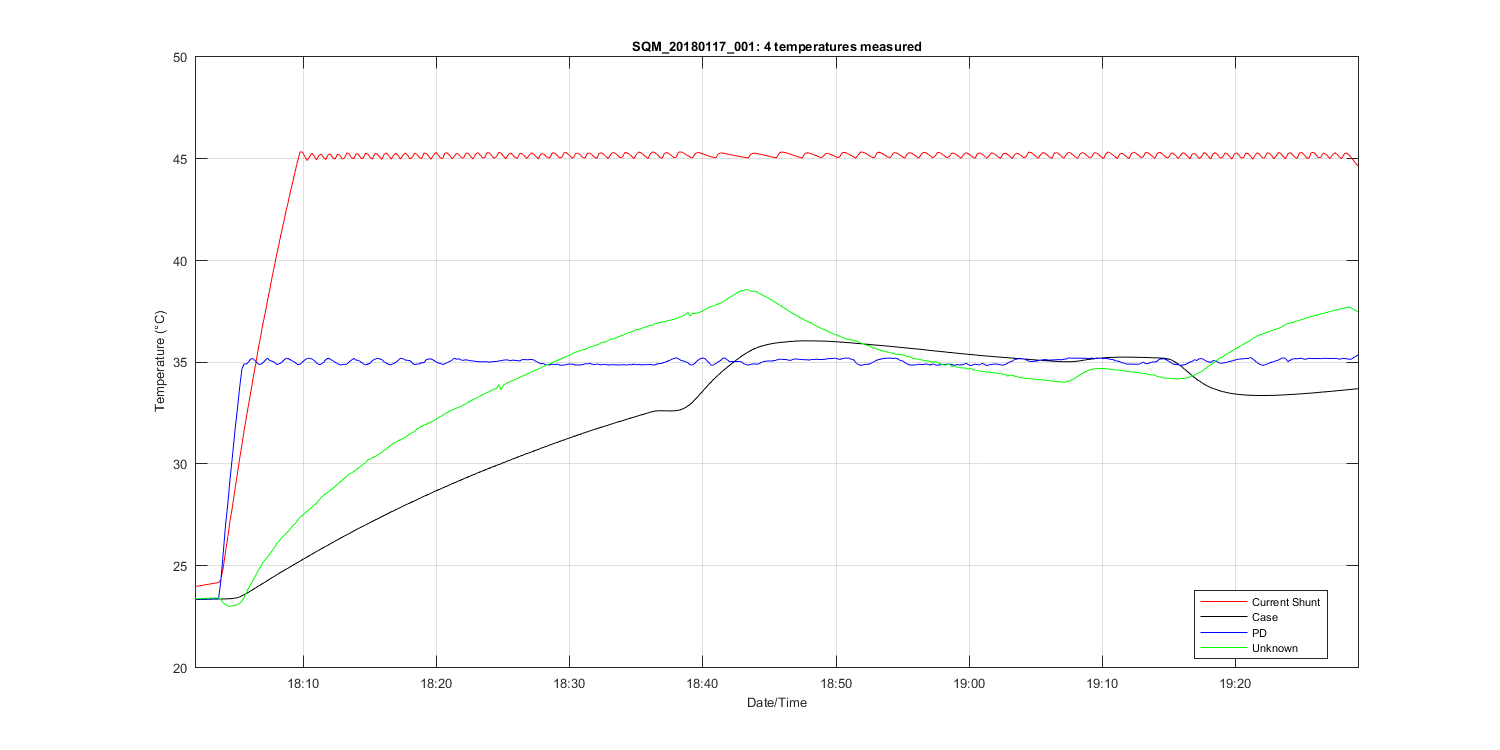
Figure 4
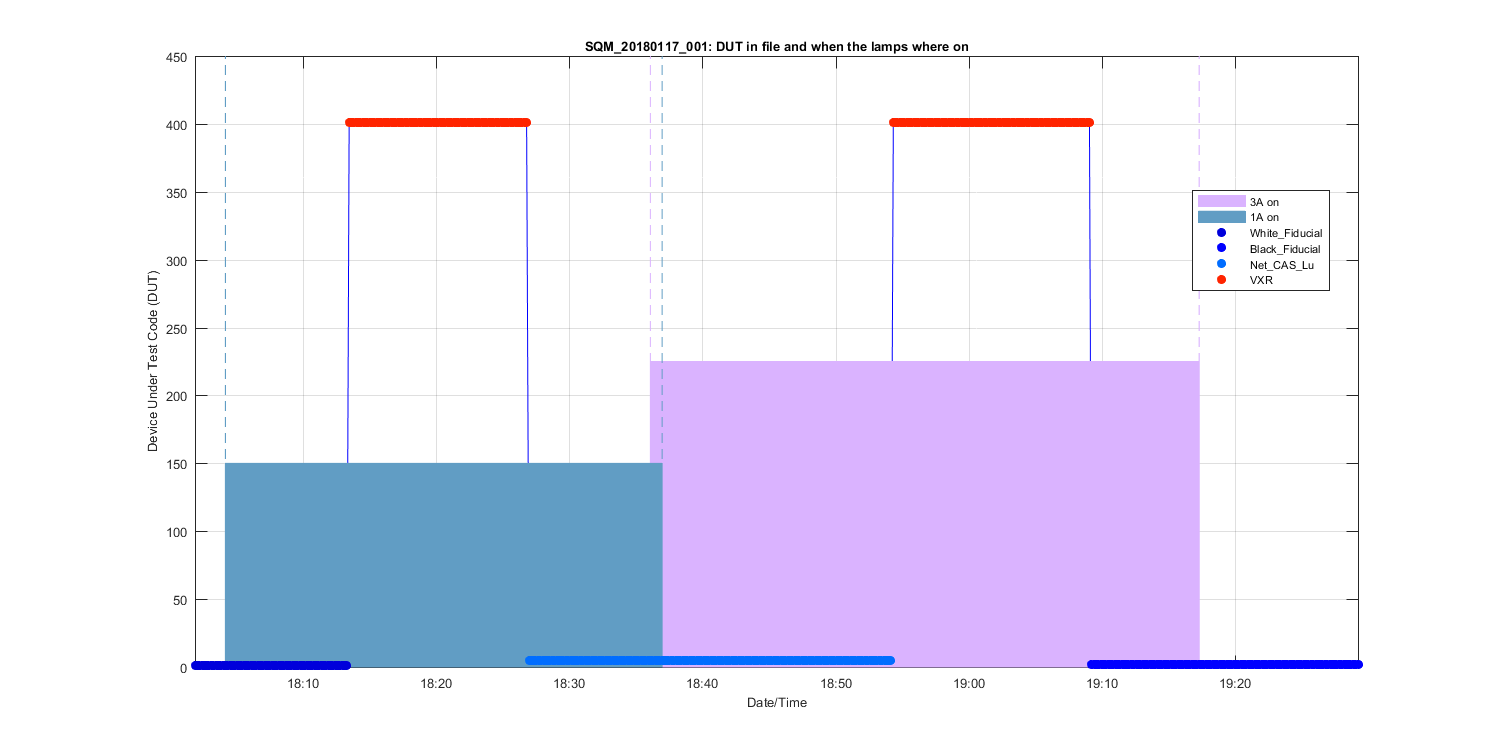
Figure 5
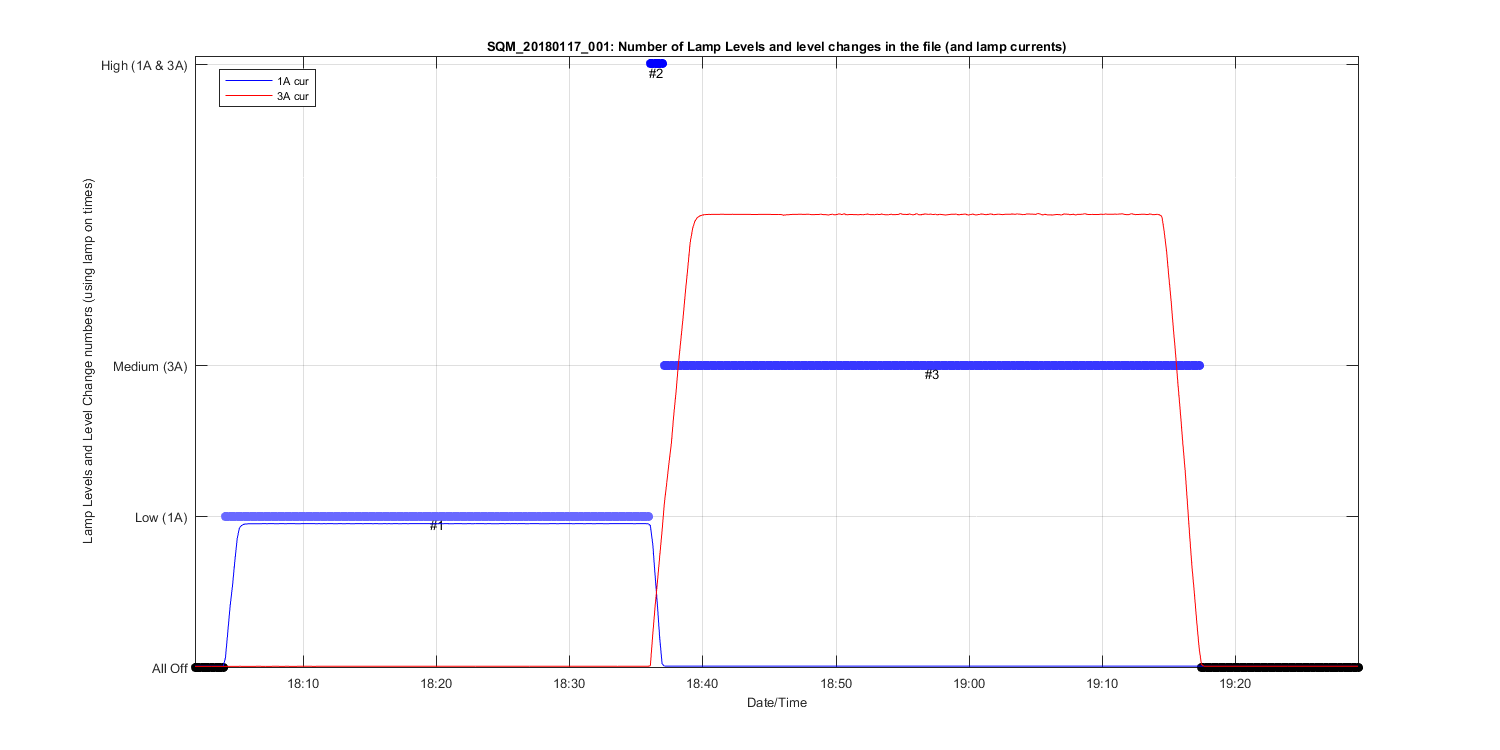
Figure 6
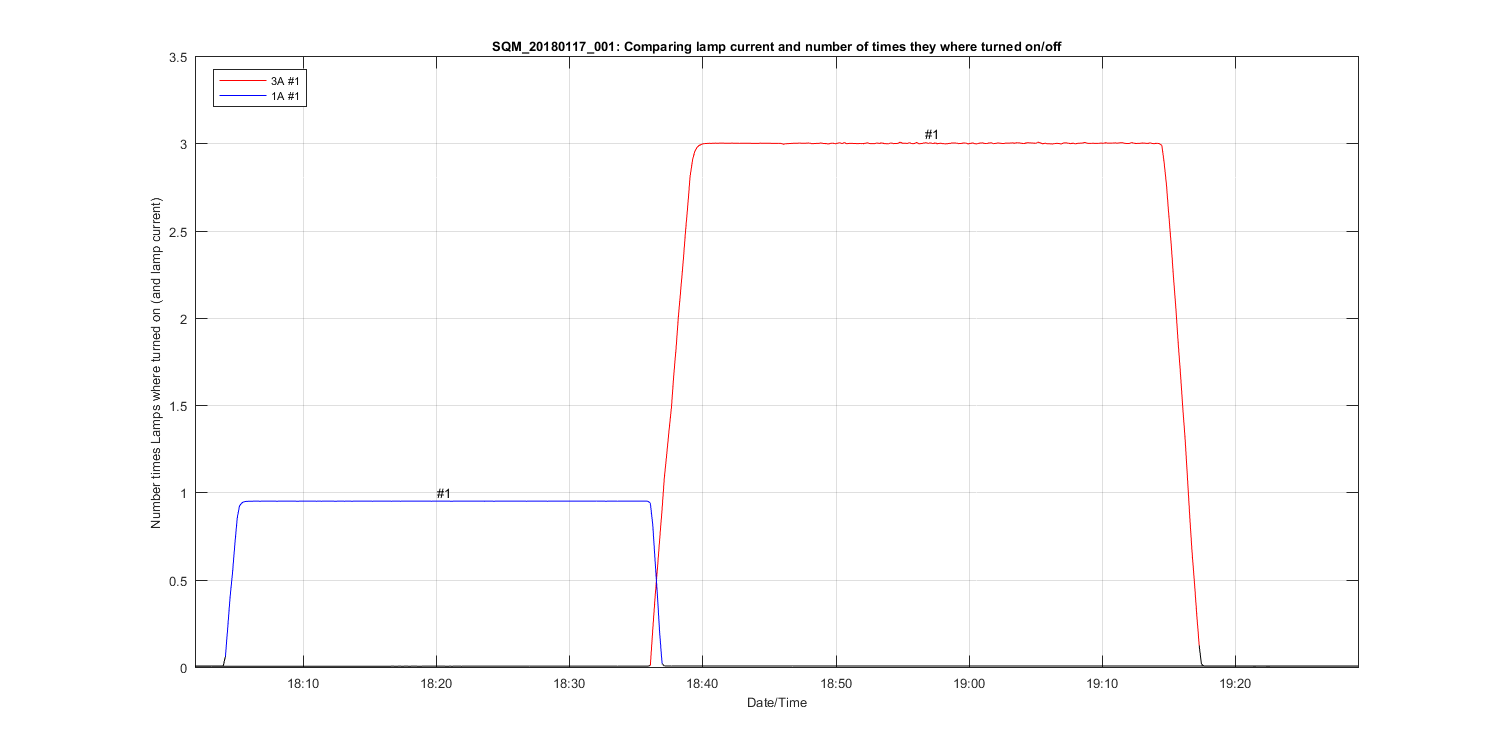
Figure 7
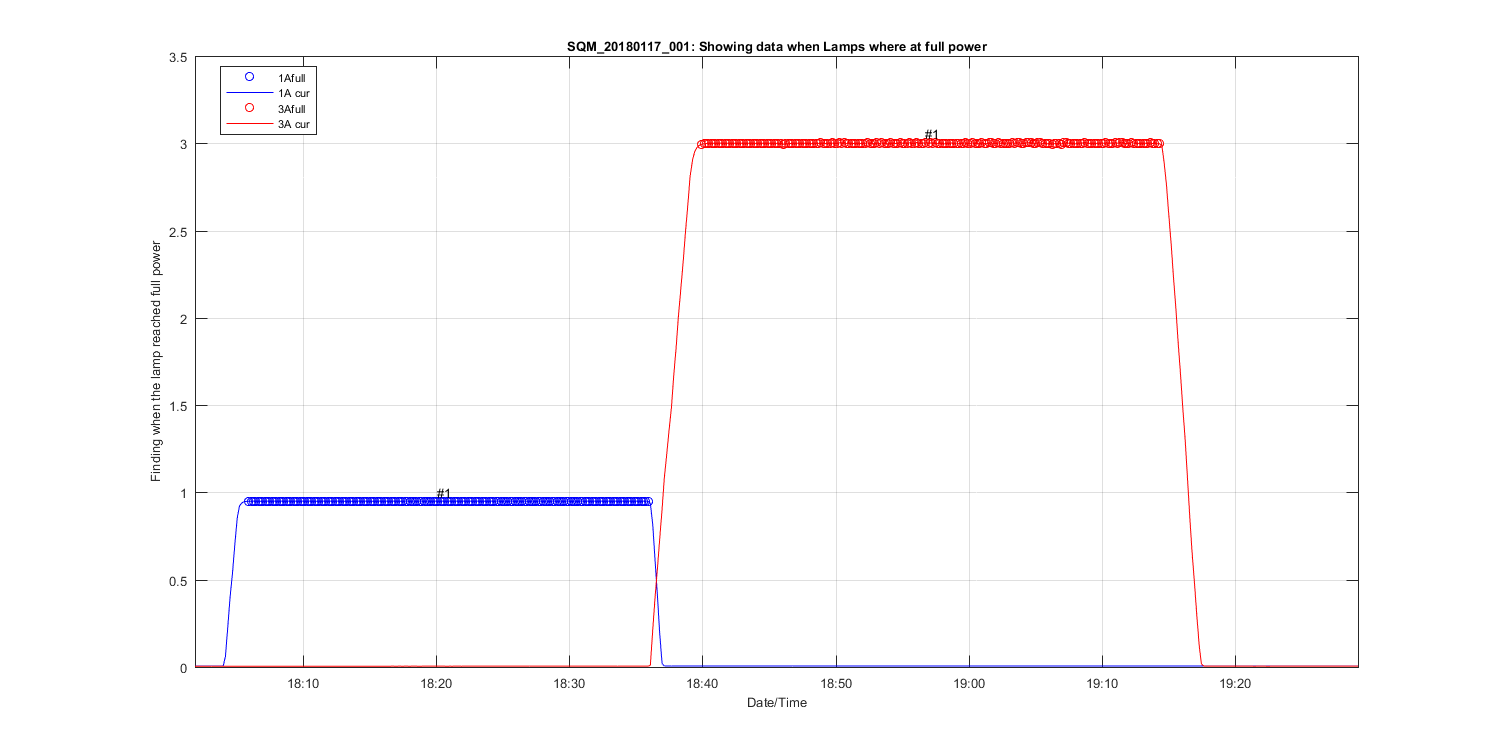
Figure 8
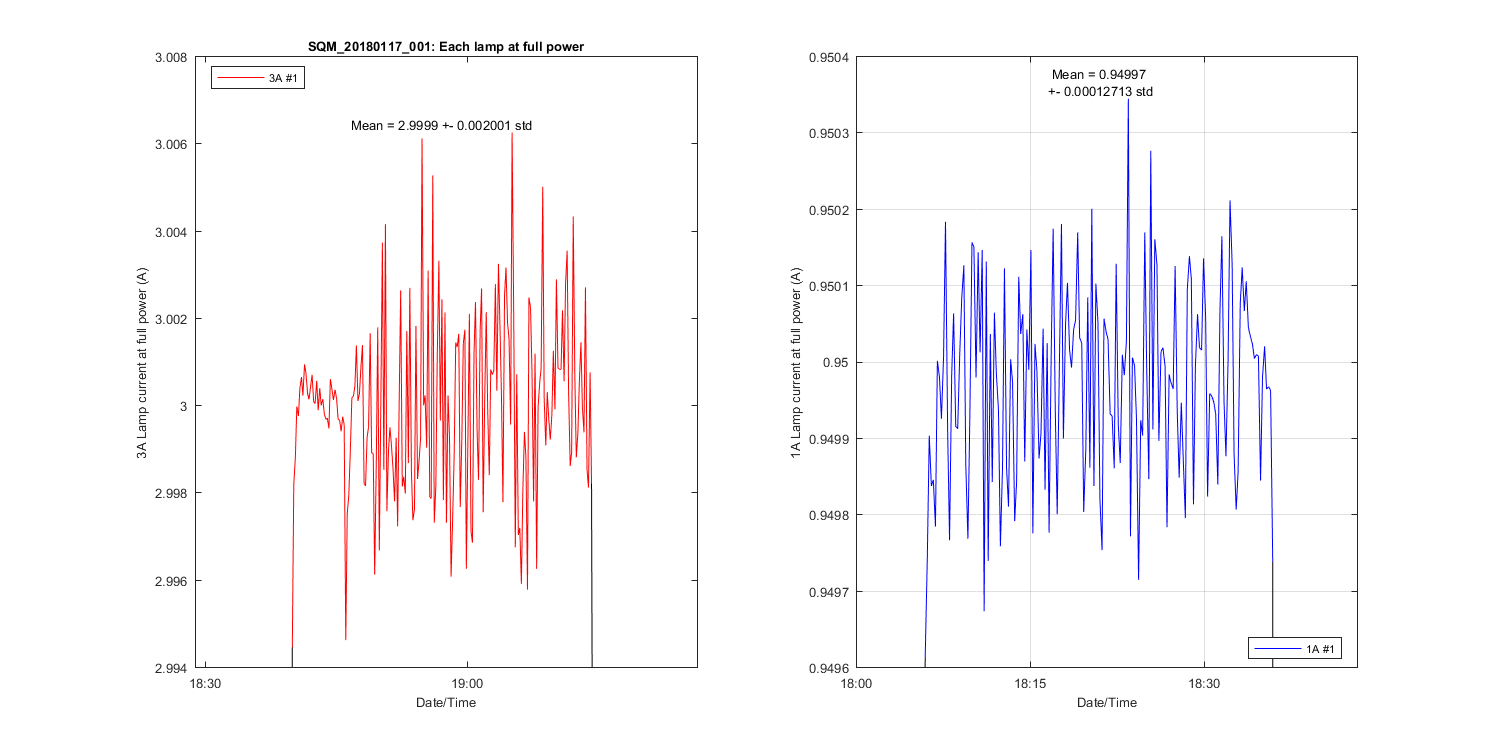
Figure 9
Figure 10