| Description | Value or Code |
|---|---|
| Cruise_Name:, Vaux(12,:) | NIST |
| Cruise_Number | 2018-001 |
| Investigator:: Vaux(16,:) | Carol Johnson |
| Location_of_Measurement: Vaux(17,:) | NIST B019_221 |
| Purpose: Vaux(18,:) | Stability Measurement |
| MOBY_NET_Sequence_Position: Vaux(20,:) | Calibration Facility |
| Ambient_Air_Temp (deg C) | 24.8 |
| Relative_Humidity (%) | 57.2 |
| #_of_Levels | 3 |
| Time_Step (sec) | 10 |
| Initial lamp state: Vaux(40,:) | All Off |
| Time_adjustment_to_GMT | 0 |
| Time_of_Last_Servicing | 20151218 |
| SQM_120VAC_On | 20180529.122000 |
| SQM_Off_to_Standby | 20180529.184023 |
| SQM_Standby_to_Off | 20180529.204231 |
| SQM_120VAC_Off | 20180529.204400 |
| Lamp 1 A burn hours | 0.9375 |
| Lamp 3 A burn hours | 1.0394 |
| DAQ_Program_Version | 19 |
| File Format Version | 2 |
| DAQ_Computer: Vaux(60,:) | EOS EQUIP 13 |
| DAQ_Program_Name: Vaux(61,:) | SQM Monitor_2.1.vi |
|
All Devices Under Test in the DUT column in DATA: DUT_White_Fiducial DUT_Black_Fiducial DUT_Net_CAS_Lu DUT_VXR DUT_SEI |
|
ASCII SQM file data: SQM_20180529_001.txt
ASCII SQM file data: PDF log file
| Lamp | On/Off # | N | Time on (hrs) | Mean (meas./set) | std | %std |
|---|---|---|---|---|---|---|
| Lamp 1A | 1 | 306 | 0.89056 | 0.94998 / 0.95 | 0.0001208 | 0.012716 |
| Lamp 3A | 1 | 318 | 0.92556 | 2.9999 / 3 | 0.0022457 | 0.07486 |
| Level | PD internal monitor (V) | Level Change # | Mean | std | %std |
|---|---|---|---|---|---|
| Low (1A) | Red | 1 | 0.27556 | 0.08799 | 31.9309 |
| Low (1A) | White | 1 | 0.26647 | 0.081815 | 33.021 |
| Low (1A) | Blue | 1 | 0.22129 | 0.0464 | 39.7631 |
| Medium (3A) | Red | 3 | 1.2943 | 0.016941 | 1.3089 |
| Medium (3A) | White | 3 | 1.436 | 0.01951 | 1.1797 |
| Medium (3A) | Blue | 3 | 1.3796 | 0.01446 | 1.228 |
| Level | Temperature (C) | Level Change # | Mean | std | %std |
|---|---|---|---|---|---|
| Low (1A) | PD | 1 | 35.0292 | 0.10377 | 0.29625 |
| Medium (3A) | PD | 3 | 34.9633 | 0.11561 | 0.33067 |
Red PD (max value): 1.3297: #of possible satureated values 0
White PD (max value): 1.4782: #of possible satureated values 0
Blue PD (max value): 1.4115: #of possible satureated values 0
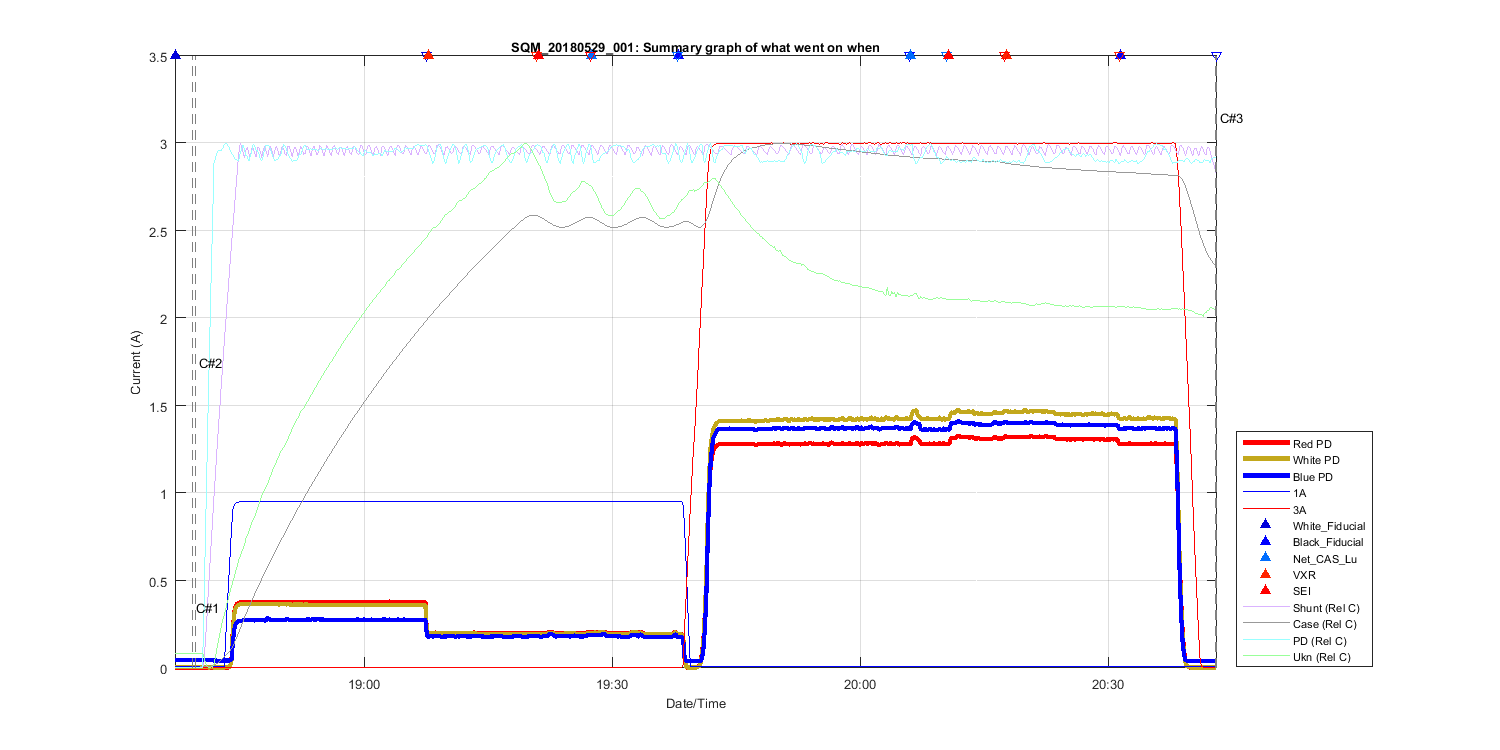
Figure 1
Summary Graph showing all measurements taken in this file, including auxilliary temperature measurements and comments. The text C# shows what time in the file the comments (shown above where made). The triangles at the top of the figure shows then a DUT (Device under test) was placed in front of the SQM and removed.
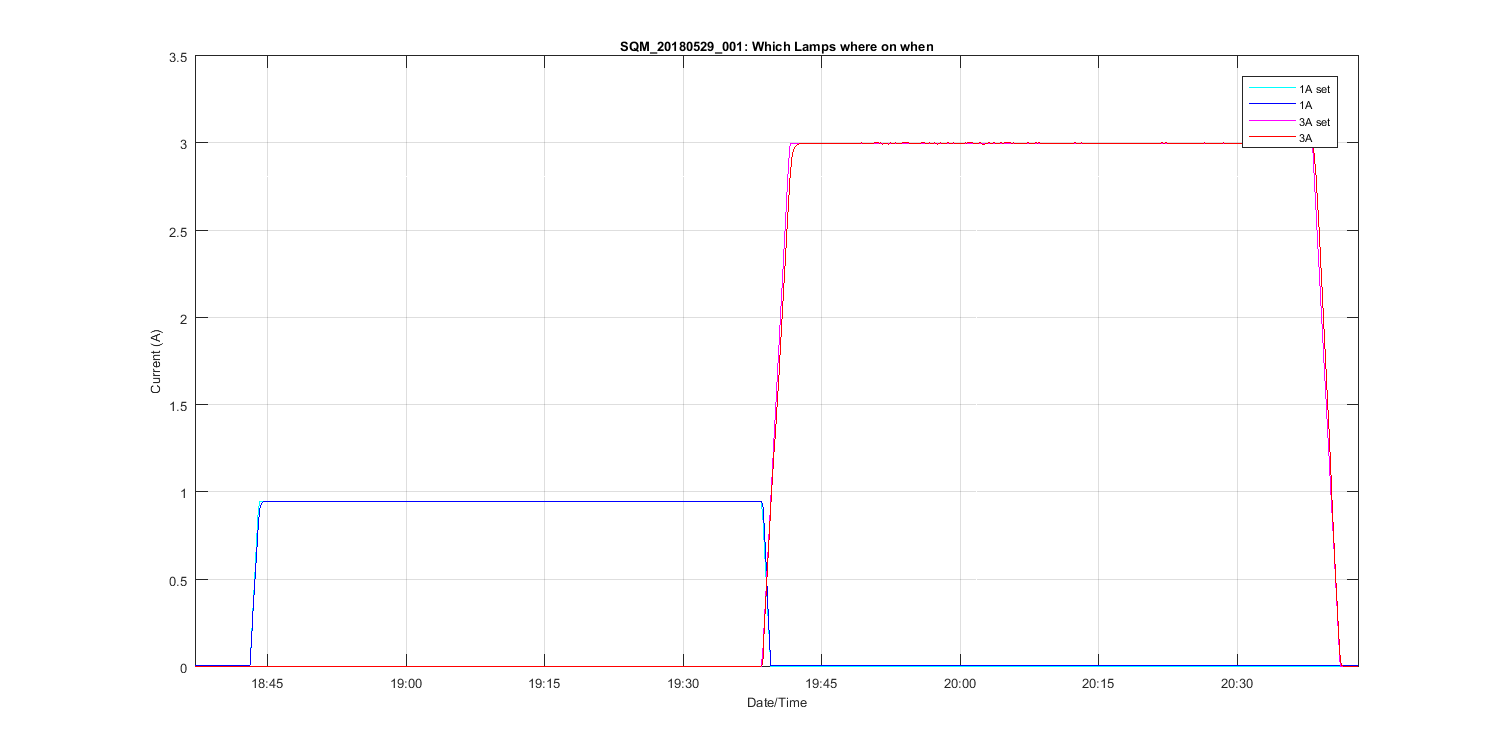
Figure 2
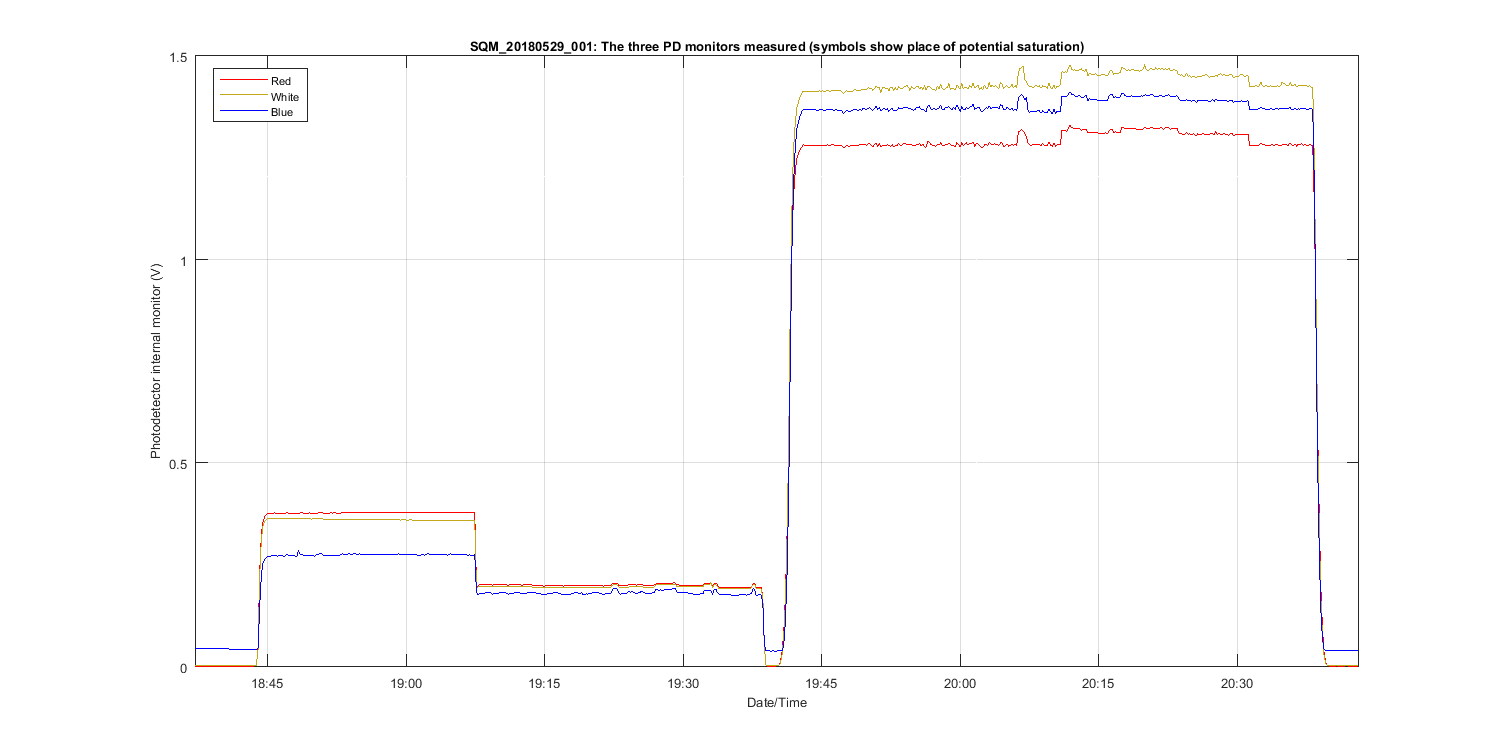
Figure 3
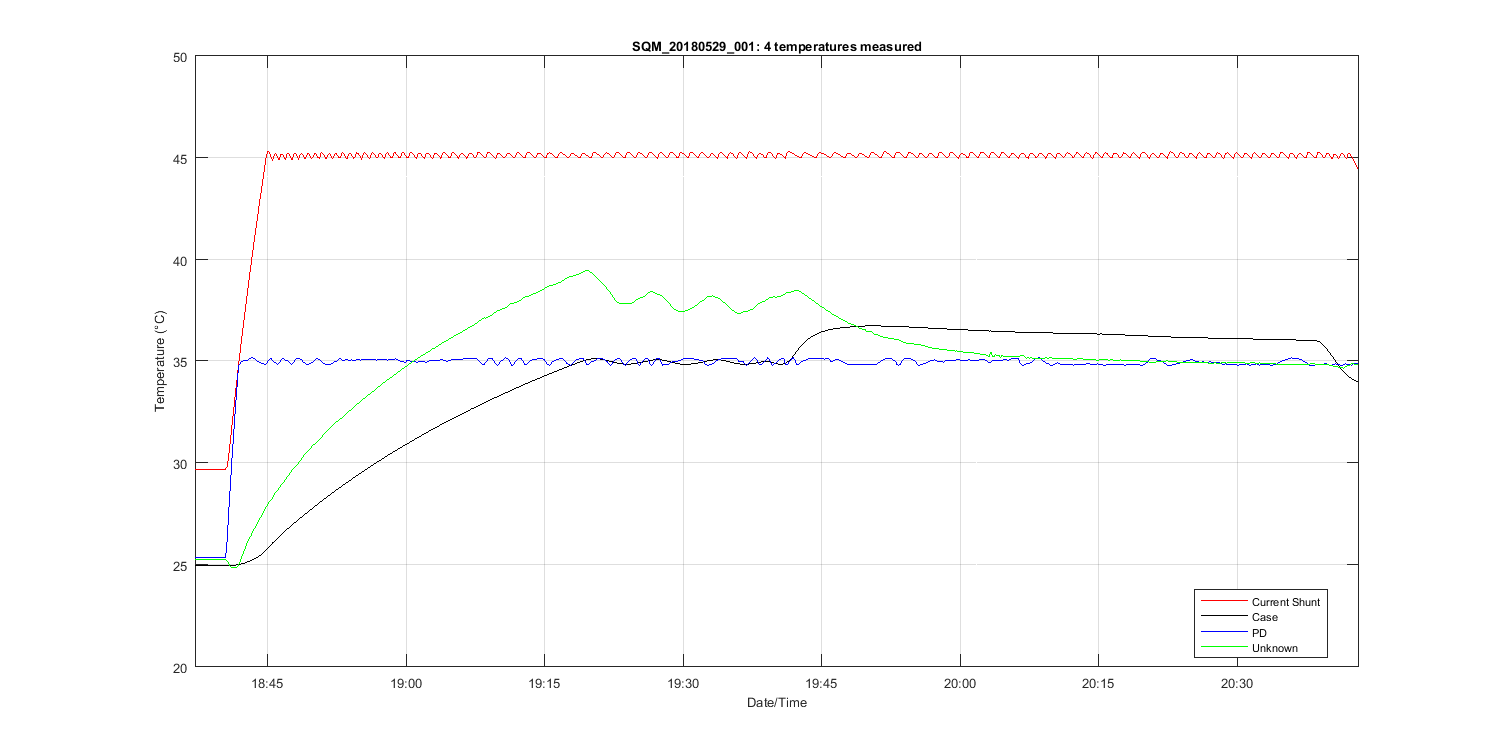
Figure 4
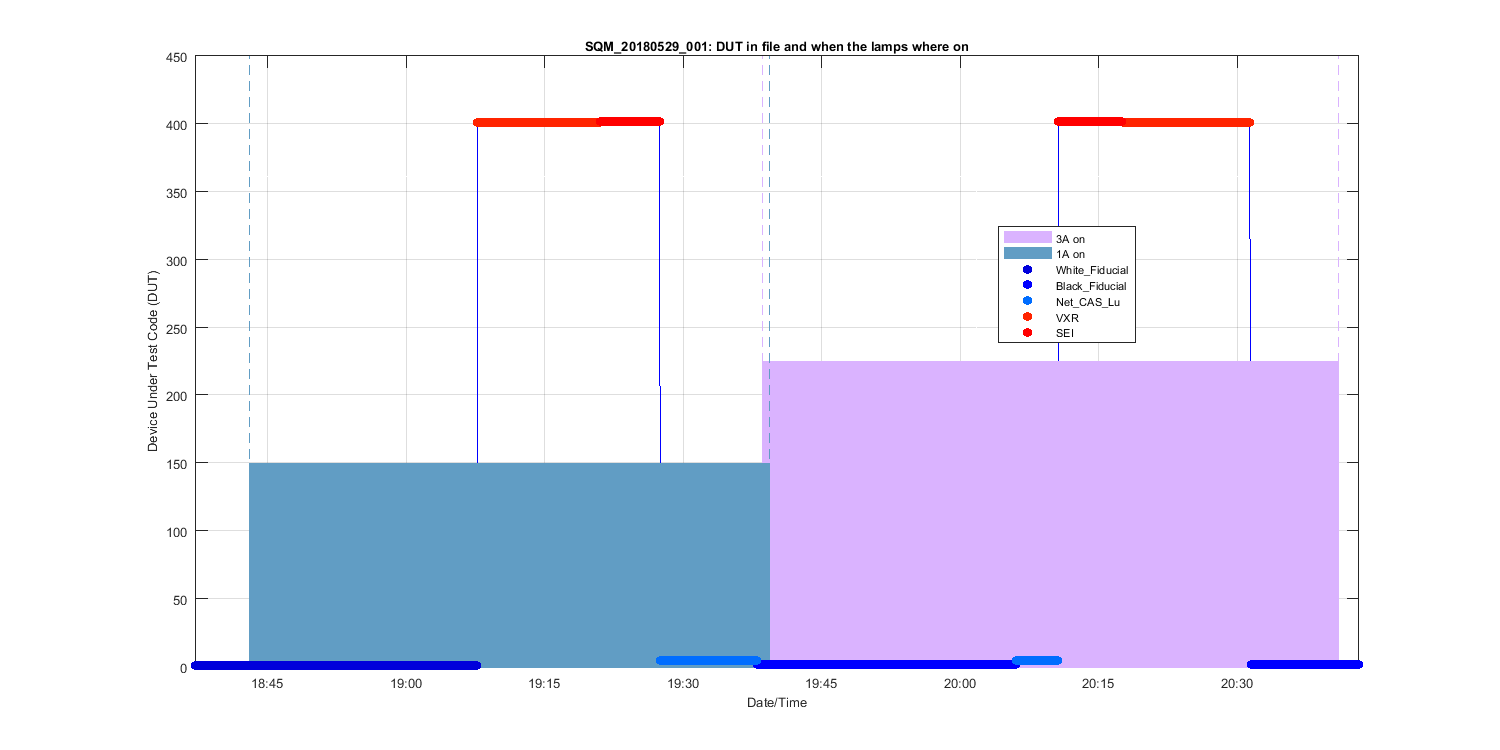
Figure 5
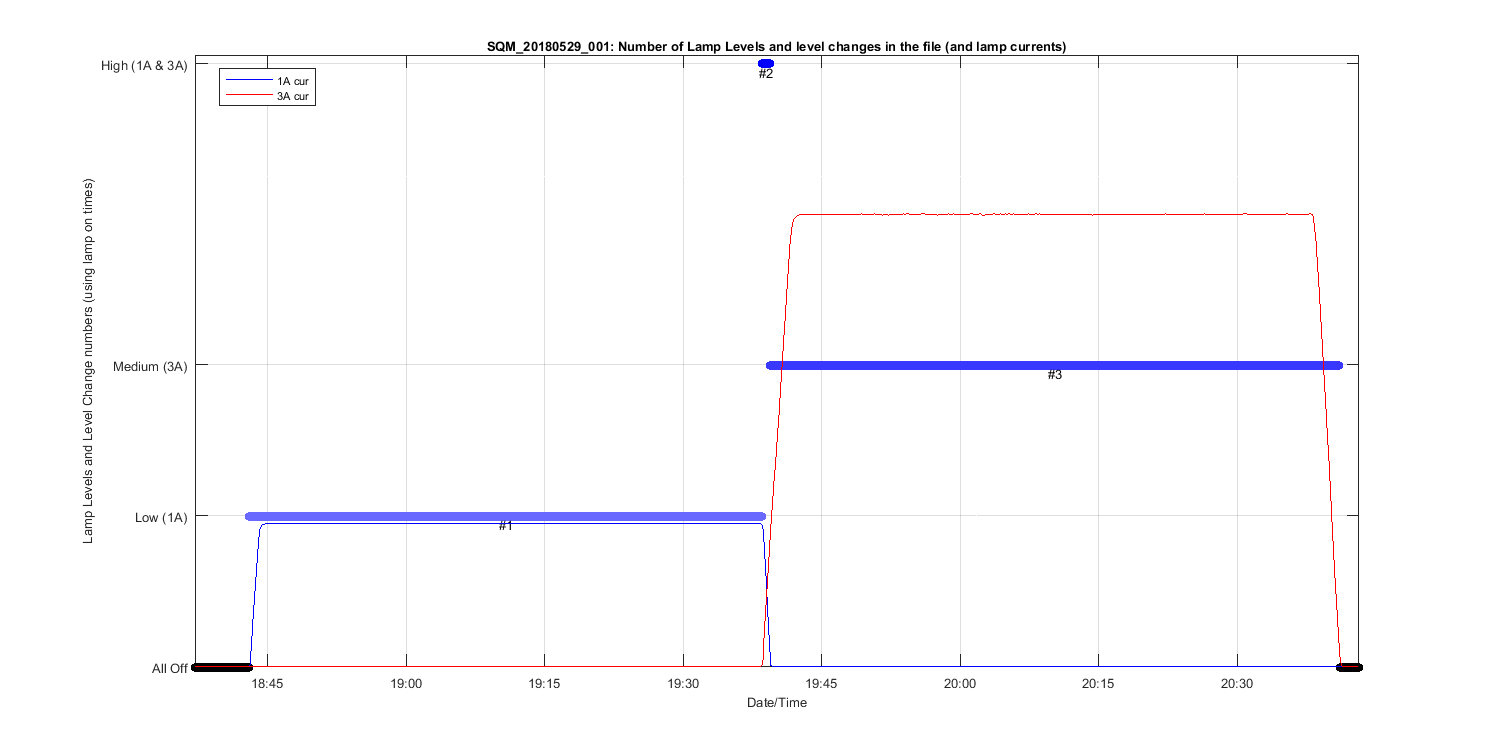
Figure 6
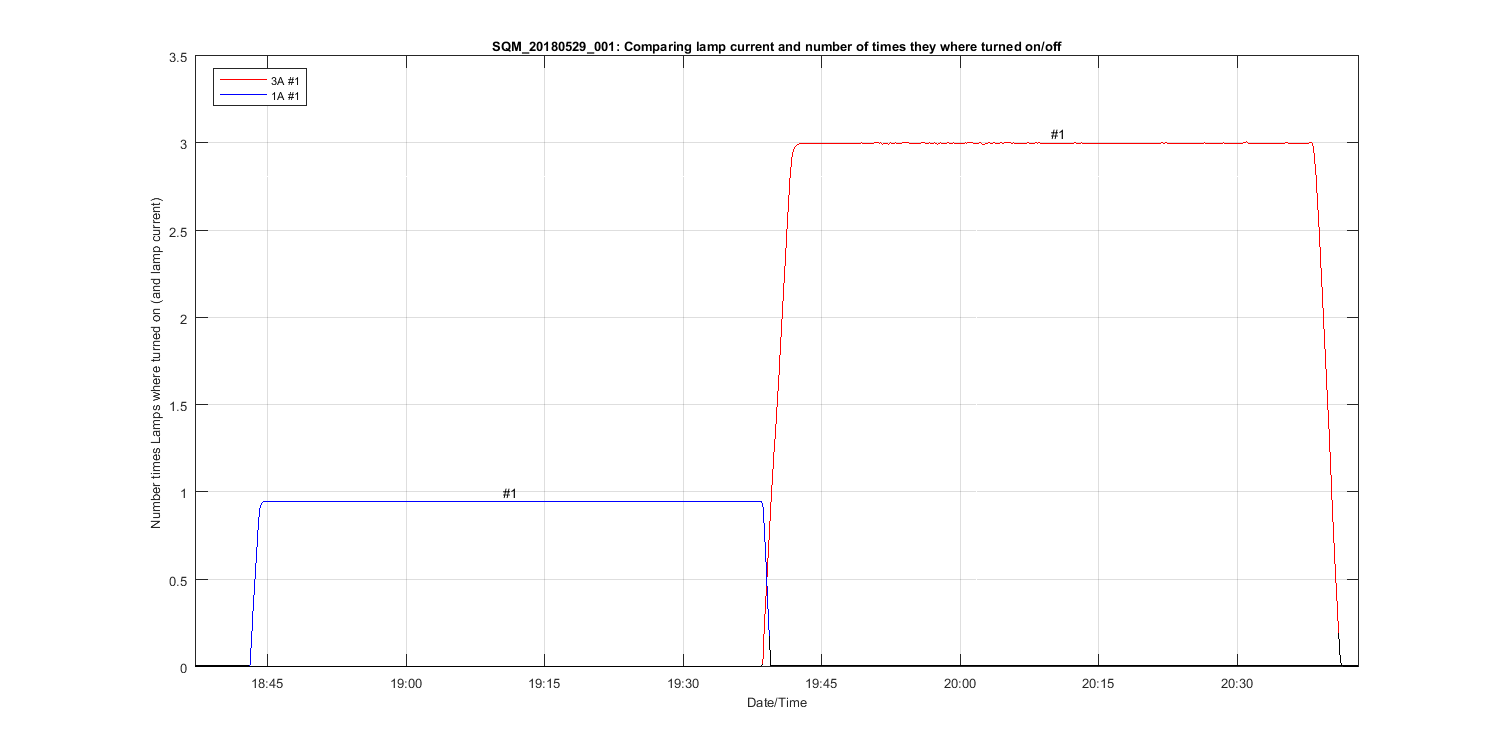
Figure 7
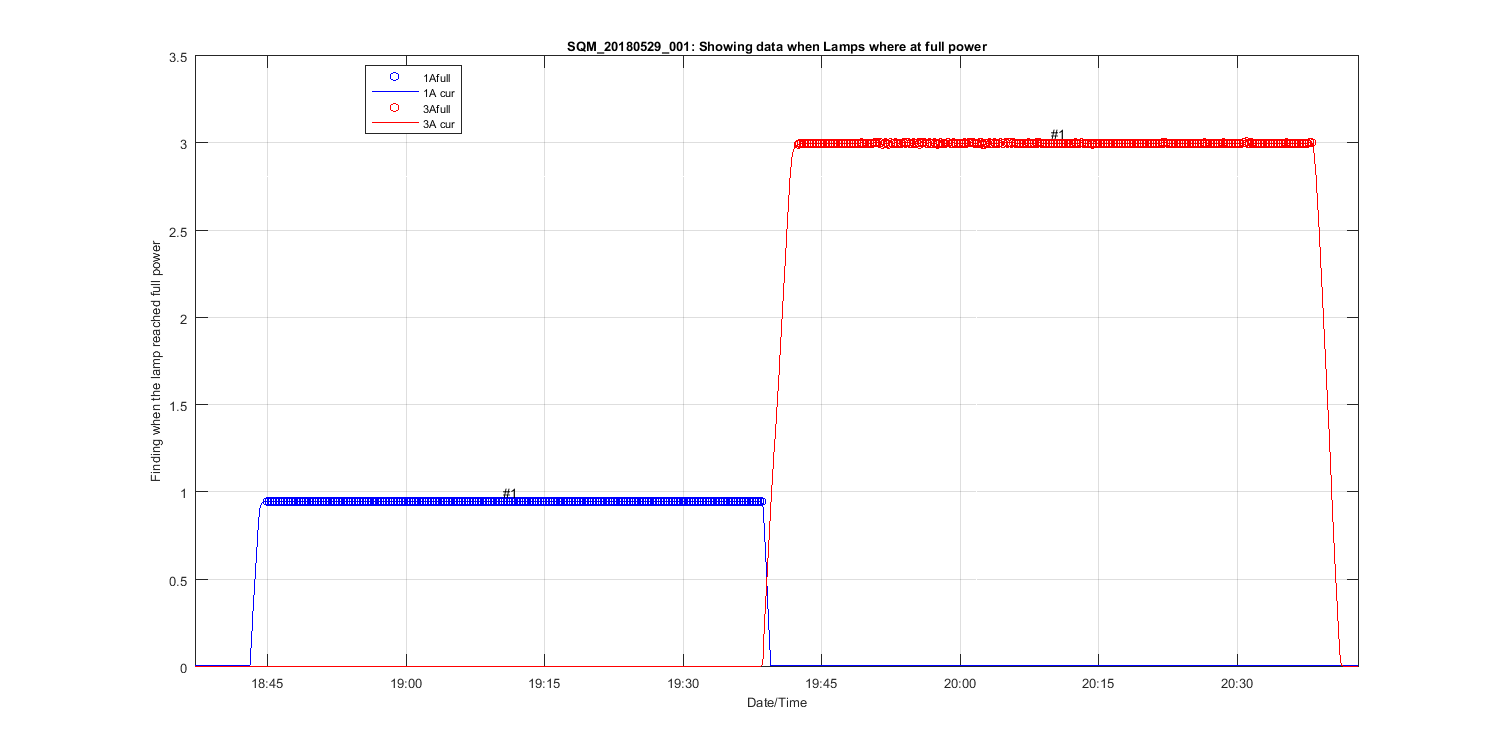
Figure 8
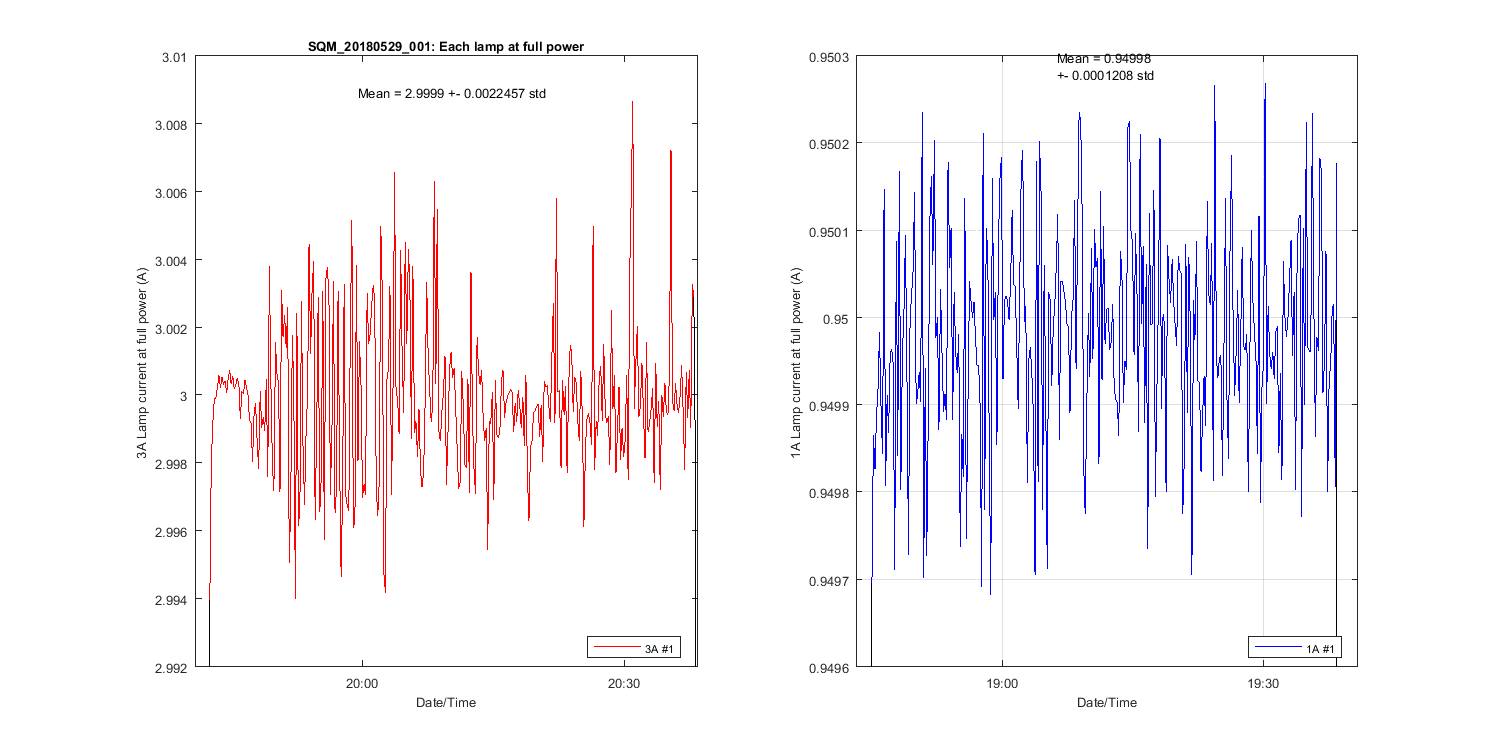
Figure 9
Figure 10