| Description | Value or Code |
|---|---|
| Cruise_Name:, Vaux(12,:) | NIST |
| Cruise_Number | 2018-001 |
| Investigator:: Vaux(16,:) | Carol Johnson |
| Location_of_Measurement: Vaux(17,:) | NIST B019_221 |
| Purpose: Vaux(18,:) | Stability Measurement |
| MOBY_NET_Sequence_Position: Vaux(20,:) | Calibration Facility |
| Ambient_Air_Temp (deg C) | 23.5 |
| Relative_Humidity (%) | 51.2 |
| #_of_Levels | 3 |
| Time_Step (sec) | 10 |
| Initial lamp state: Vaux(40,:) | All Off |
| Time_adjustment_to_GMT | 0 |
| Time_of_Last_Servicing | 20151218 |
| SQM_120VAC_On | 20180711.145120 |
| SQM_Off_to_Standby | 20180711.145350 |
| SQM_Standby_to_Off | 20180711.162736 |
| SQM_120VAC_Off | 20180711.163000 |
| Lamp 1 A burn hours | 0.68333 |
| Lamp 3 A burn hours | 0.85556 |
| DAQ_Program_Version | 19 |
| File Format Version | 2 |
| DAQ_Computer: Vaux(60,:) | EOS EQUIP 13 |
| DAQ_Program_Name: Vaux(61,:) | SQM Monitor_2.1.vi |
|
All Devices Under Test in the DUT column in DATA: DUT_White_Fiducial DUT_Black_Fiducial DUT_Net_CAS_Lu DUT_VXR DUT_SEI |
|
ASCII SQM file data: SQM_20180711_001.txt
ASCII SQM file data: PDF log file
| Lamp | On/Off # | N | Time on (hrs) | Mean (meas./set) | std | %std |
|---|---|---|---|---|---|---|
| Lamp 1A | 1 | 219 | 0.63667 | 0.94999 / 0.95 | 0.00012392 | 0.013044 |
| Lamp 3A | 1 | 254 | 0.73889 | 3.0001 / 3 | 0.0011357 | 0.037855 |
| Level | PD internal monitor (V) | Level Change # | Mean | std | %std |
|---|---|---|---|---|---|
| Low (1A) | Red | 1 | 0.27197 | 0.08731 | 32.1031 |
| Low (1A) | White | 1 | 0.26484 | 0.082386 | 32.9669 |
| Low (1A) | Blue | 1 | 0.21894 | 0.046045 | 39.8786 |
| Medium (3A) | Red | 3 | 1.2939 | 0.017785 | 1.3746 |
| Medium (3A) | White | 3 | 1.4334 | 0.019493 | 1.2408 |
| Medium (3A) | Blue | 3 | 1.377 | 0.016169 | 1.2916 |
| Level | Temperature (C) | Level Change # | Mean | std | %std |
|---|---|---|---|---|---|
| Low (1A) | PD | 1 | 35.017 | 0.10631 | 0.30359 |
| Medium (3A) | PD | 3 | 35.01 | 0.12307 | 0.35152 |
Red PD (max value): 1.3313: #of possible satureated values 0
White PD (max value): 1.4776: #of possible satureated values 0
Blue PD (max value): 1.412: #of possible satureated values 0
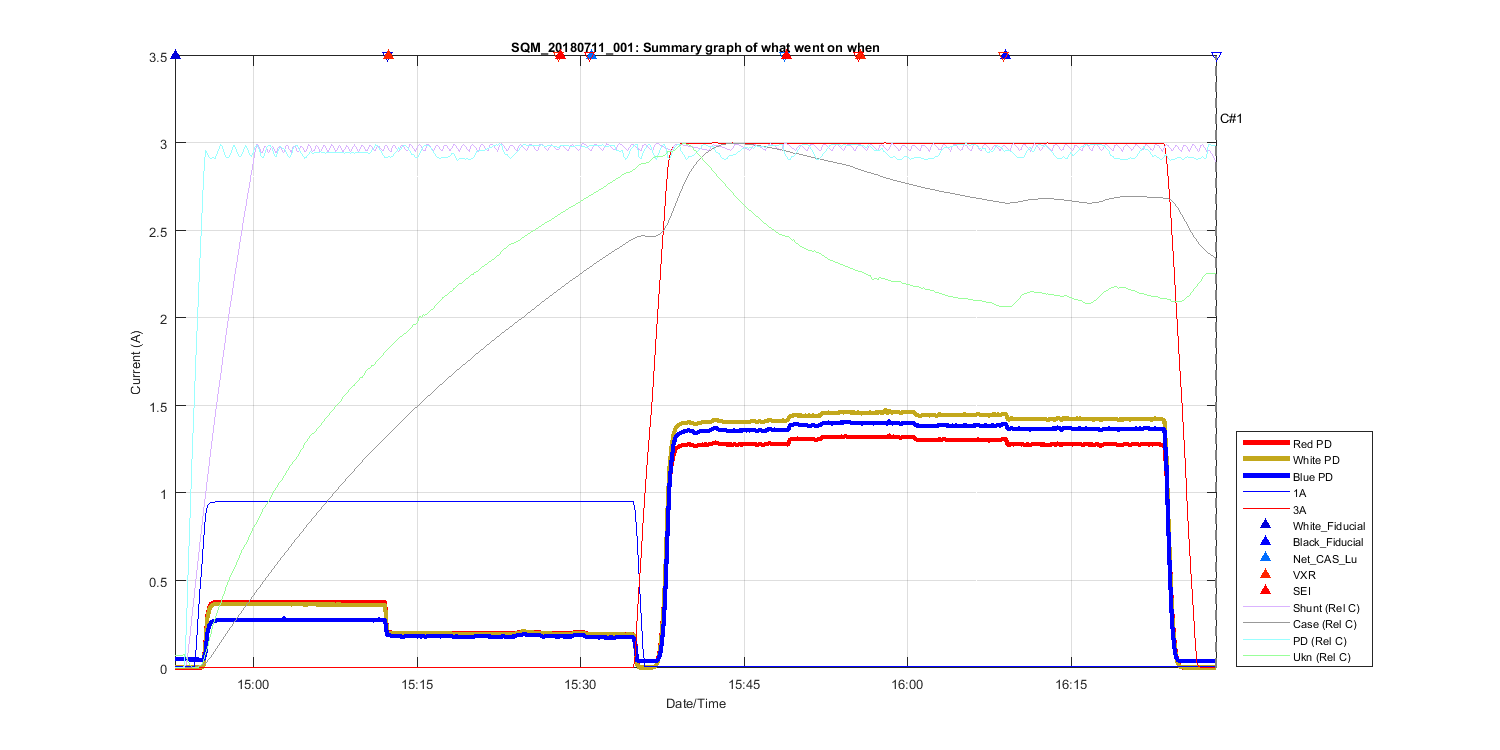
Figure 1
Summary Graph showing all measurements taken in this file, including auxilliary temperature measurements and comments. The text C# shows what time in the file the comments (shown above where made). The triangles at the top of the figure shows then a DUT (Device under test) was placed in front of the SQM and removed.
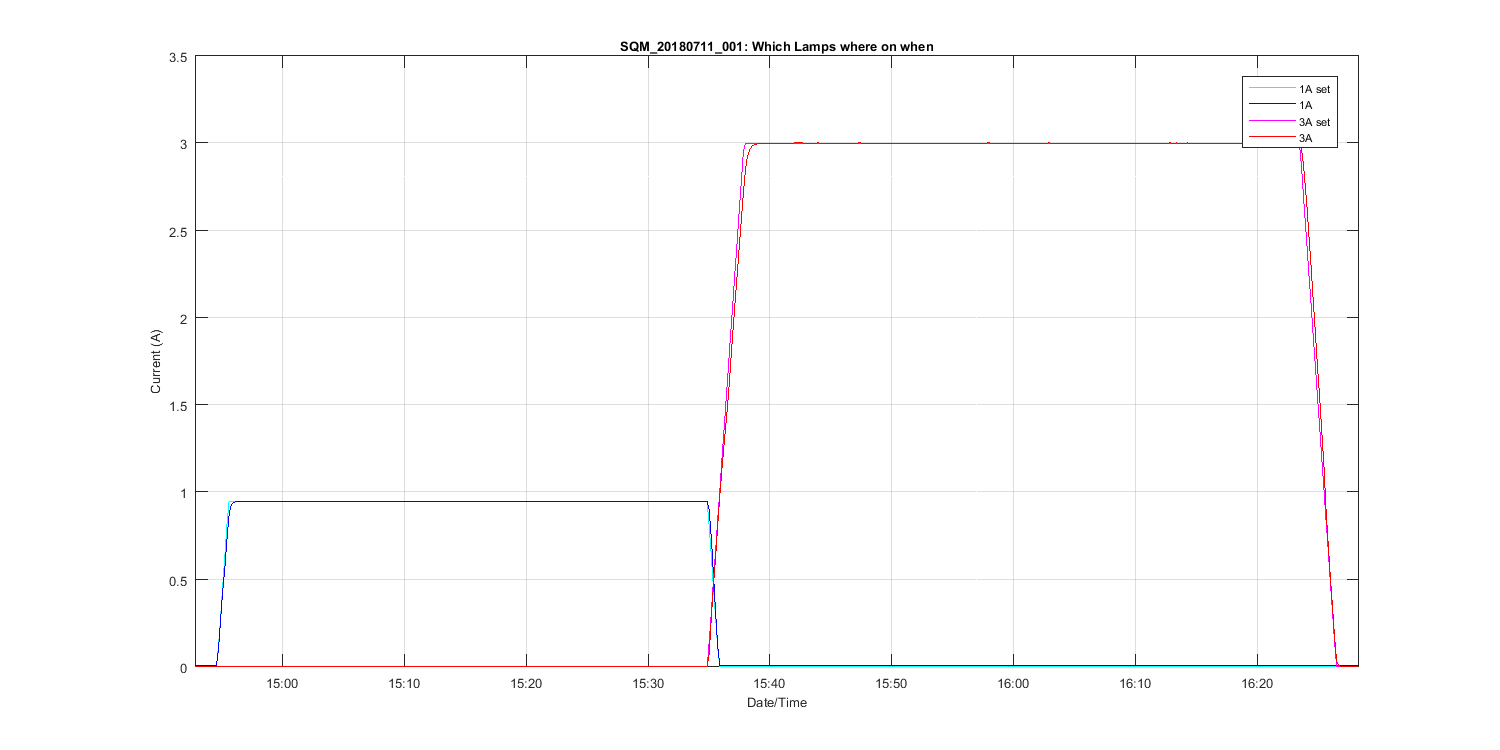
Figure 2
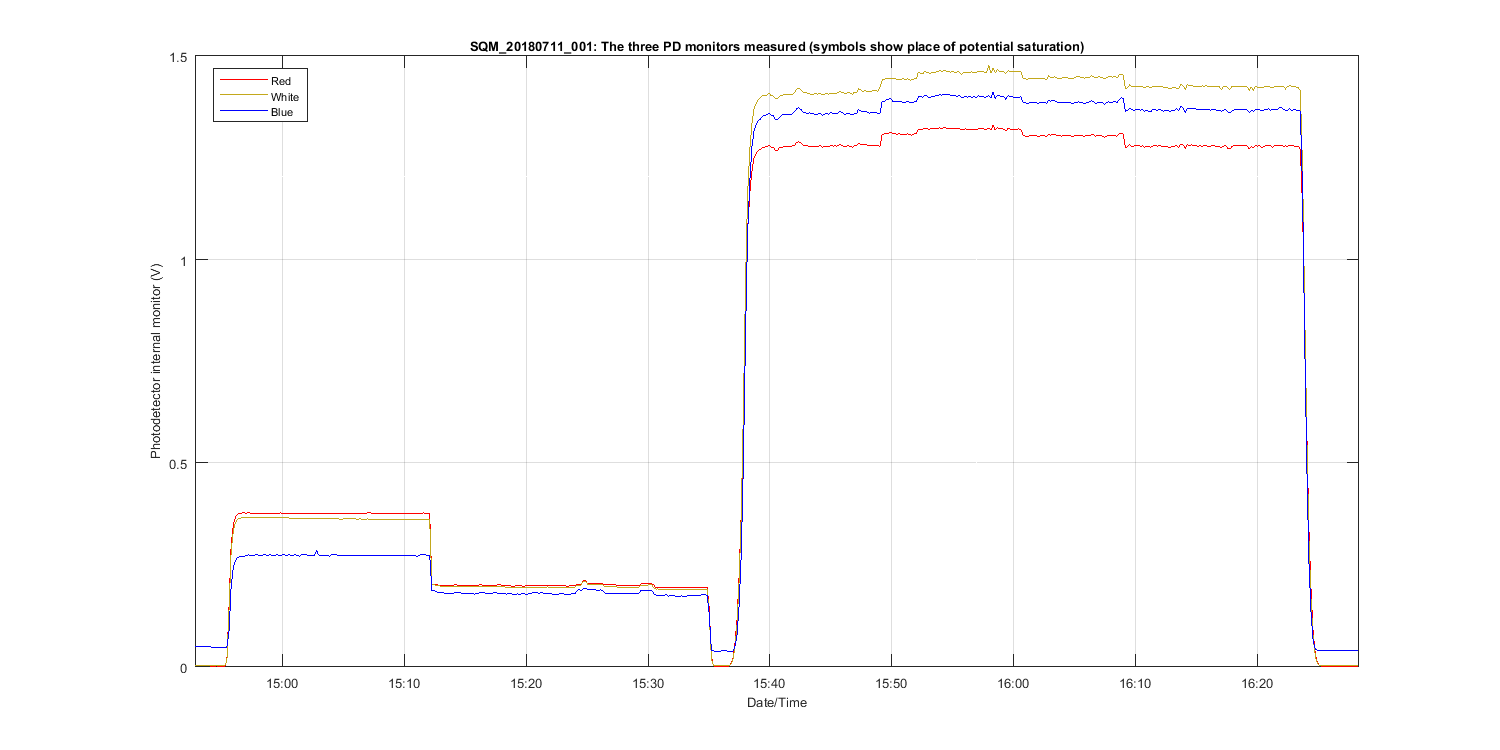
Figure 3
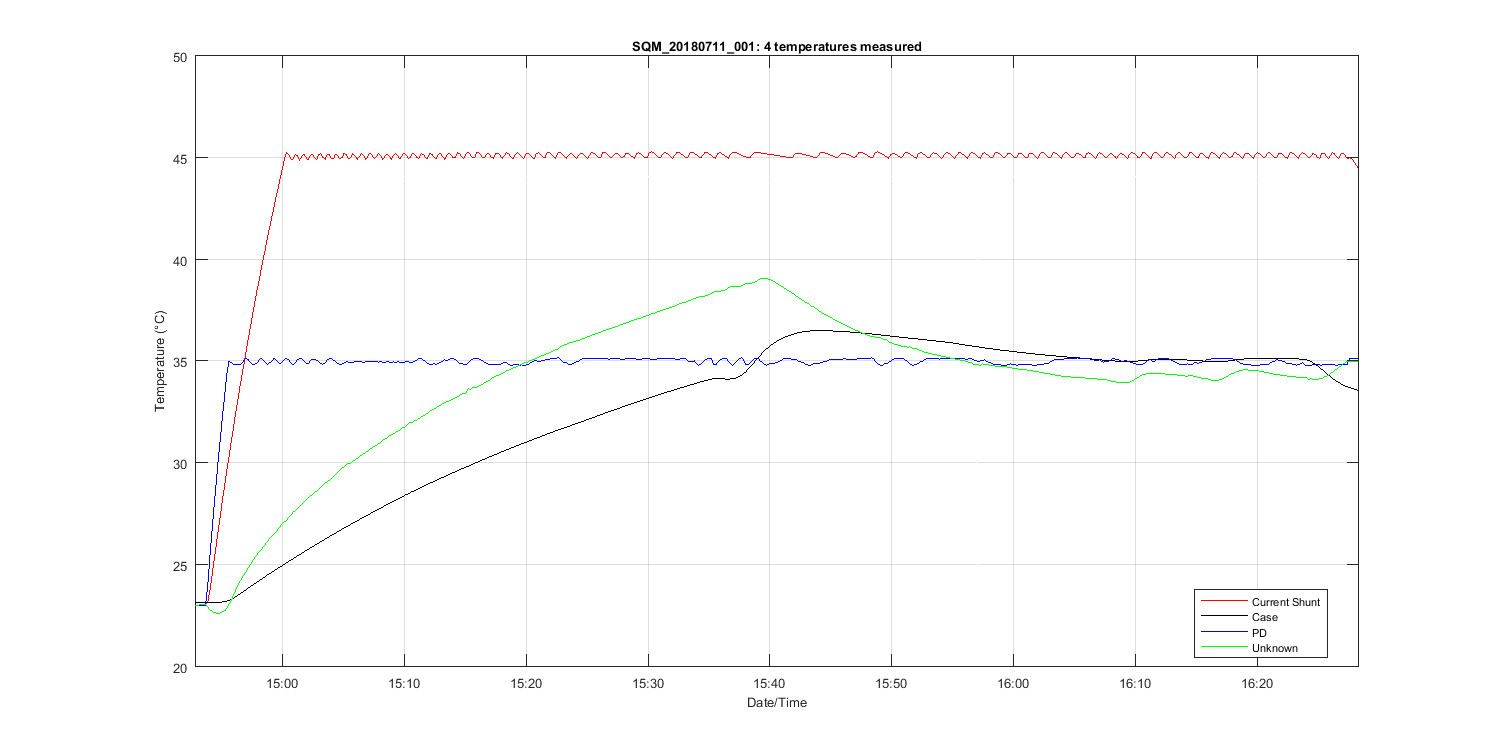
Figure 4
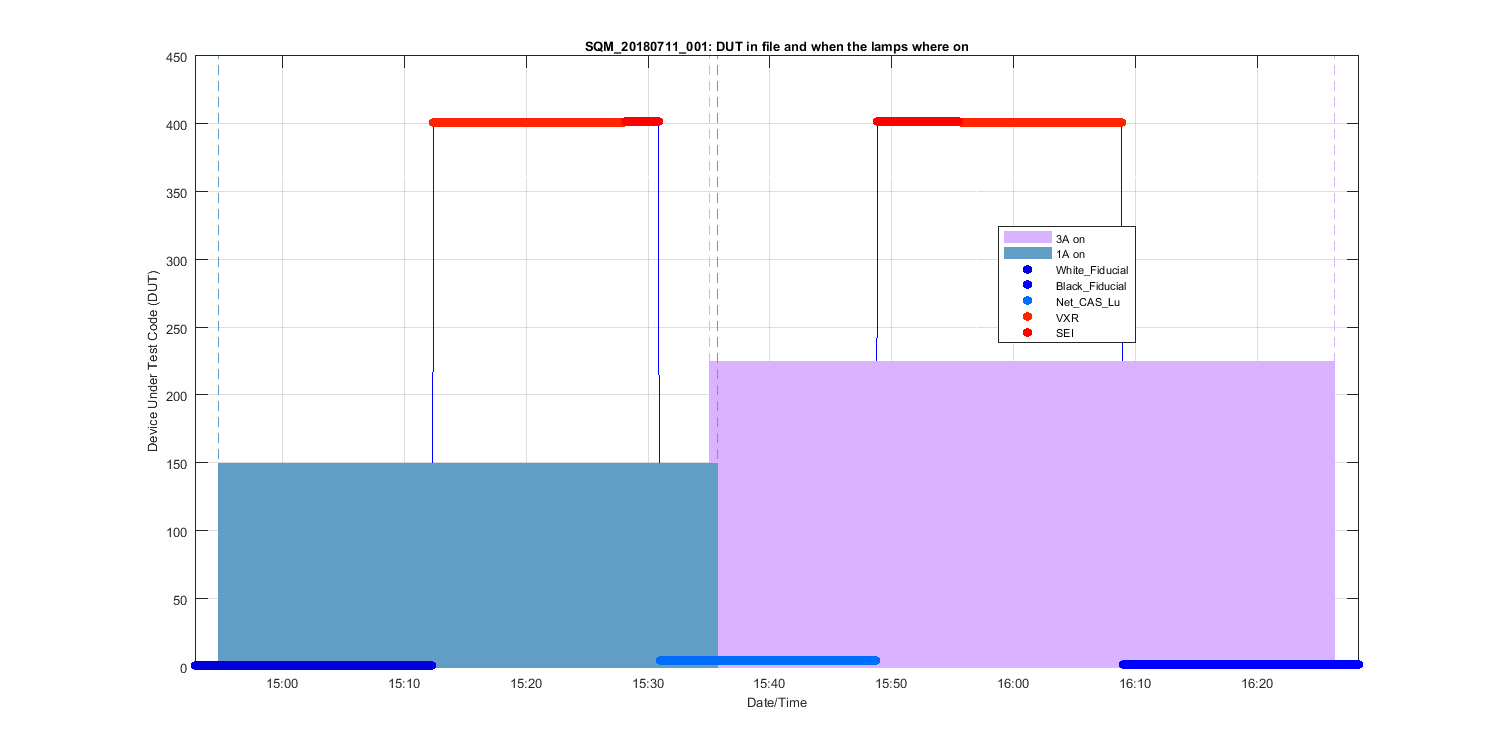
Figure 5
Figure 6
Figure 7
Figure 8
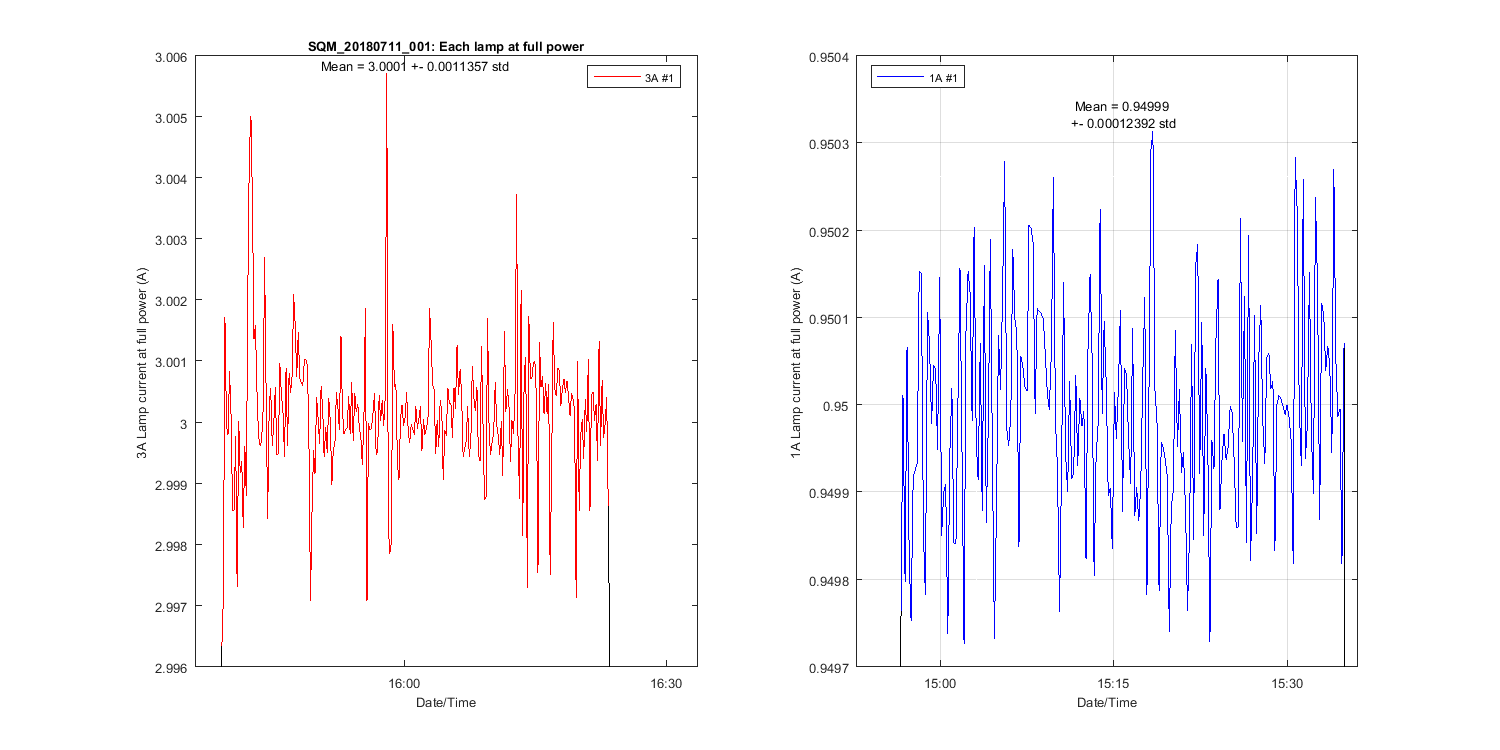
Figure 9
Figure 10