REVISION DATE: 18-Mar-2019 09:40:42
MOBY265 BS03 in-water HDF data sets.
| Previous | HOME | RAW HTML | ||||||
|---|---|---|---|---|---|---|---|---|
| Filename | Type | Total Exposure Time | Temperature | Data date | Pre Amplifier Gain | Matrix Max (ADU) | Matrix Mean (ADU) | Matrix % std |
| 20180626_210047 | light005 | 4.1437 | NaN | - | 0 | 40395 | 2029.34 | 298.54 |
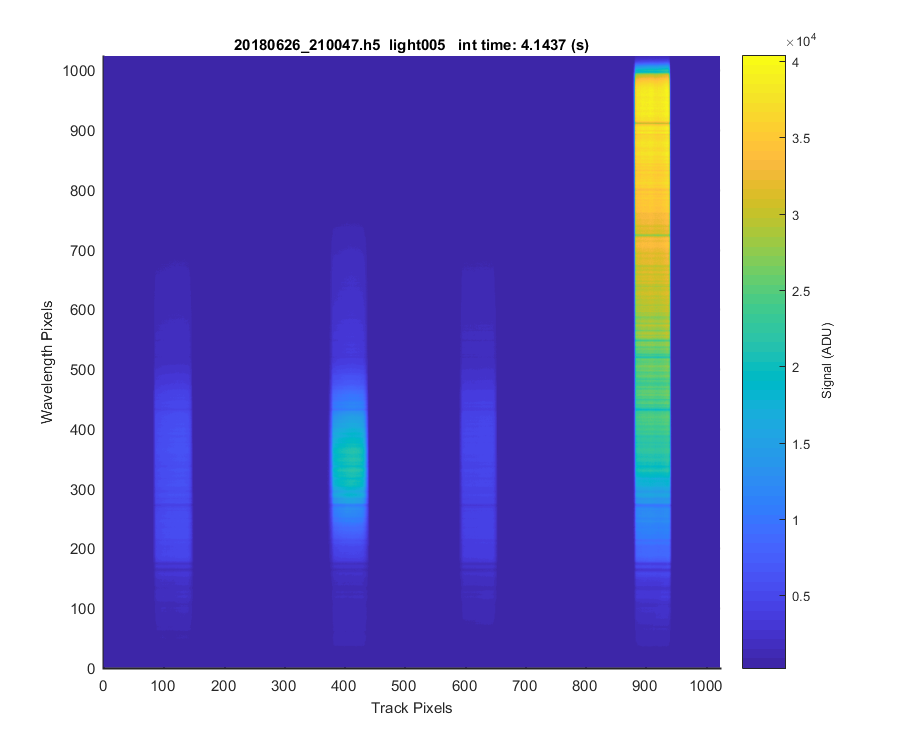
Figure 1: Top down surface of the data. Colorbar is in ADU.
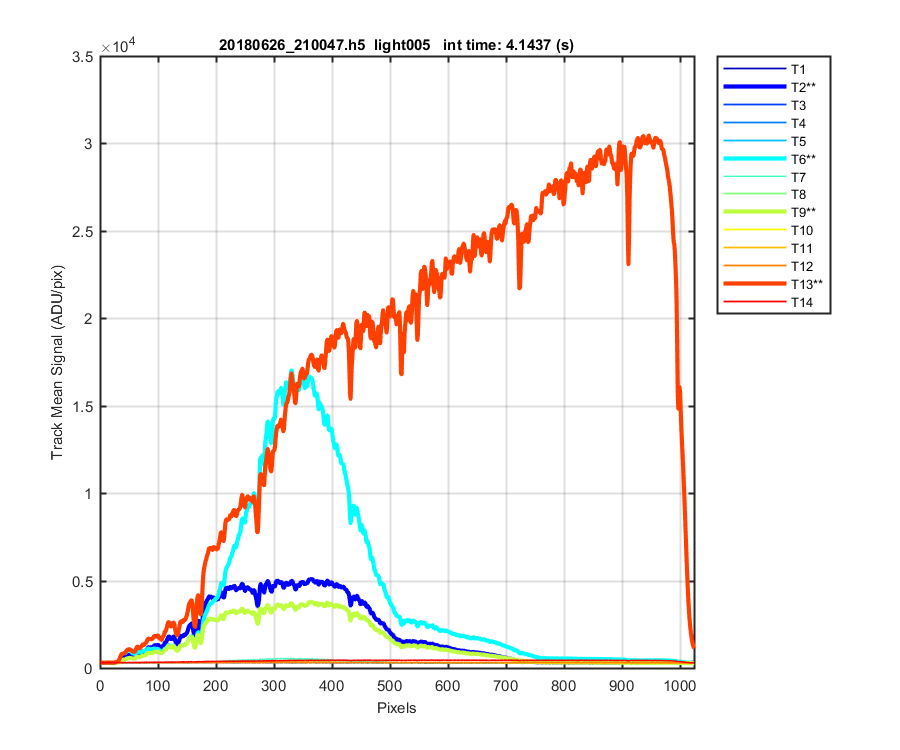
Figure 2: Track means for the 14 graphs. Units are ADU/pix because it is a track mean. Illuminated tracks have a ** in the legend.
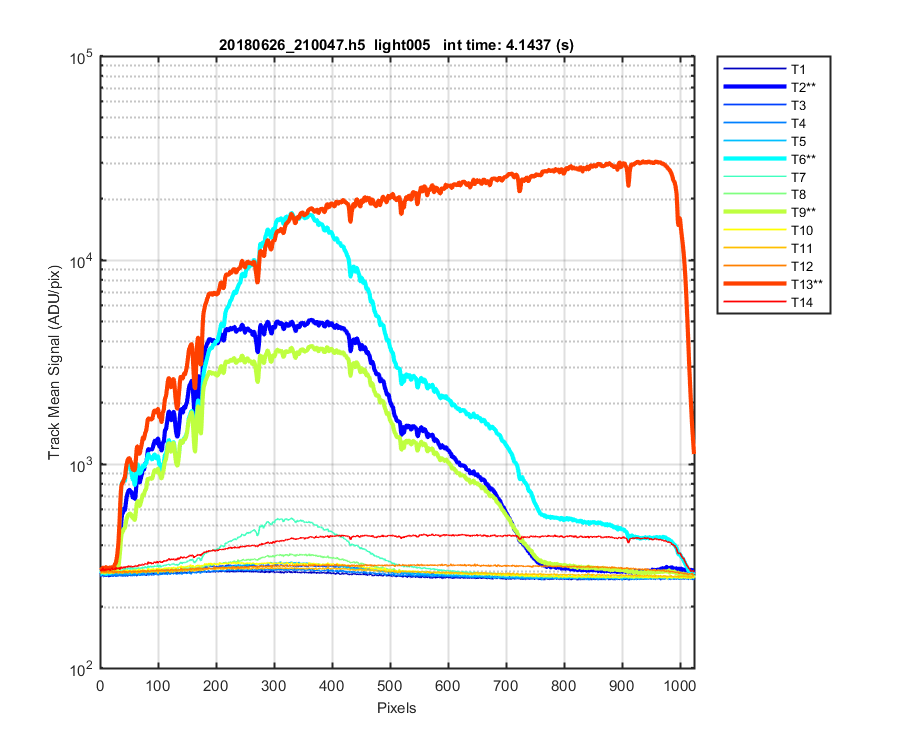
Figure 3: Semilogty version of the track means for the 14 graphs. Units are ADU/pix because it is a track mean. Illuminated tracks have a ** in the legend.
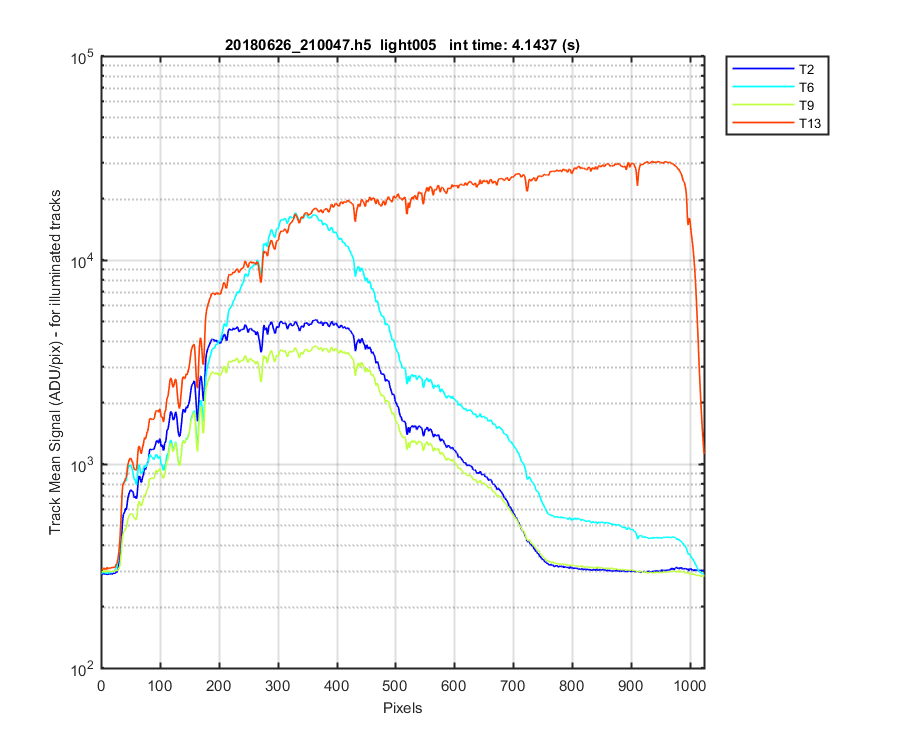
Figure 4: Just the illuminated tracks
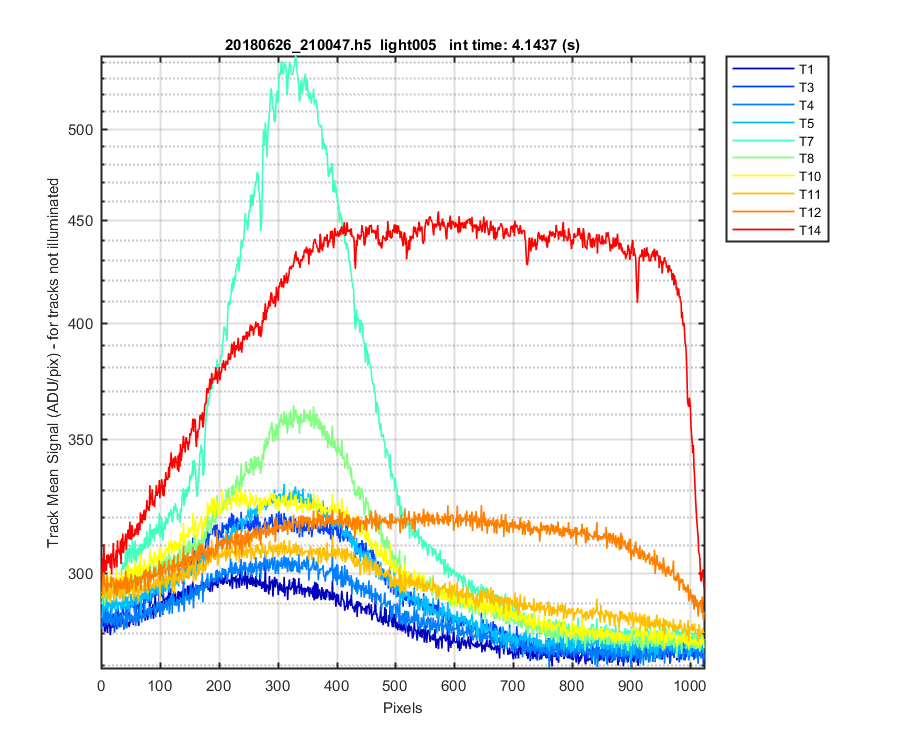
Figure 5: The illuminated no illumiated. This show the cross track stray lgiht in ADU/pix units
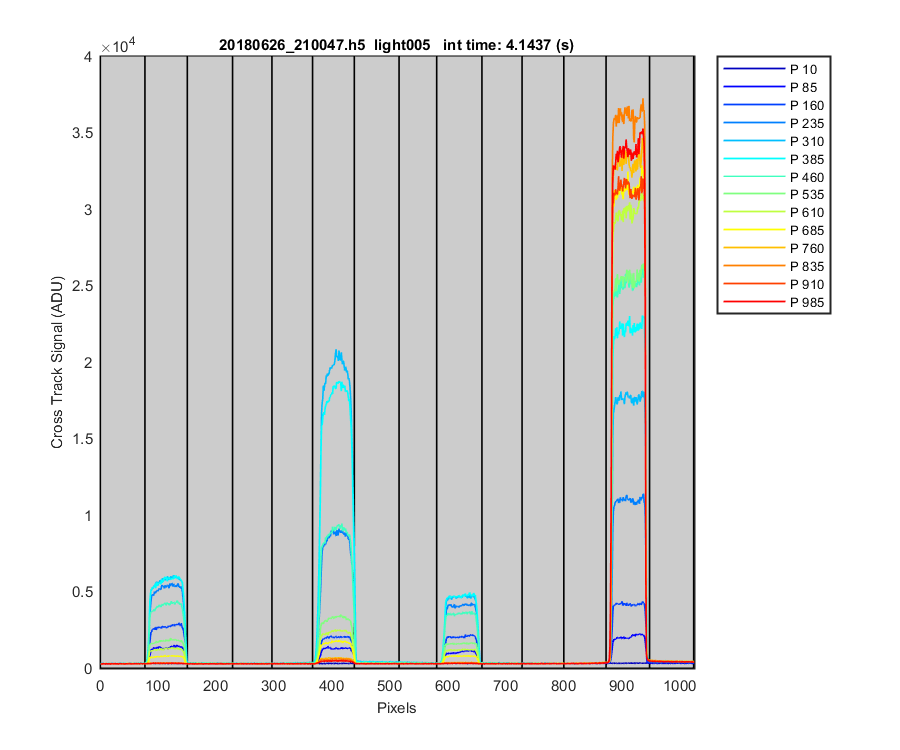
Figure 6: Cross track plots showing the data at different pixels and the track definitions
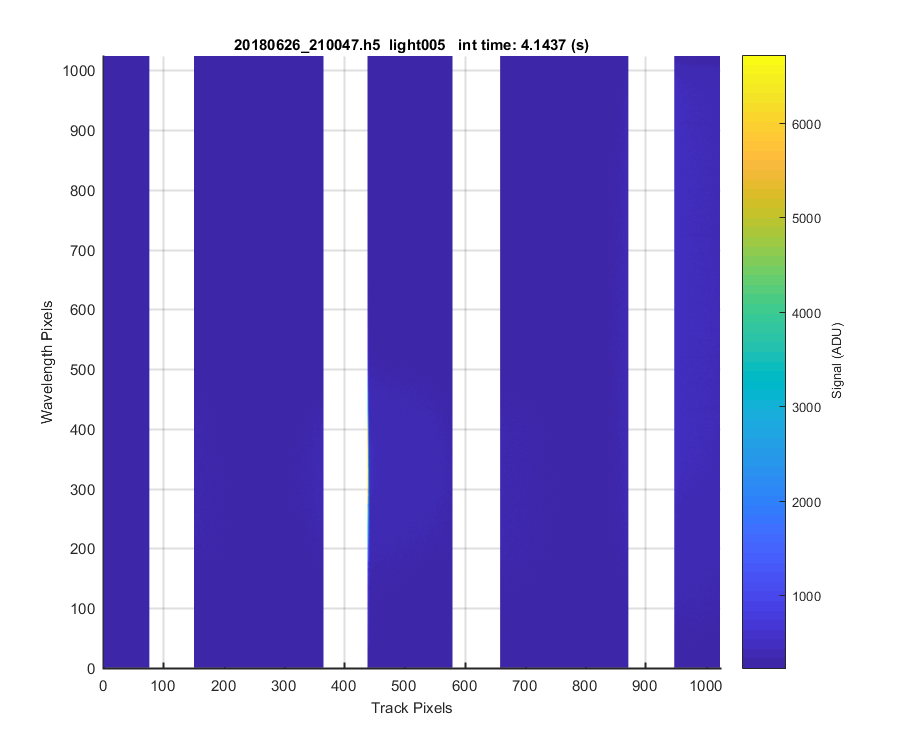
Figure 7: Surface plot with the illuminated tracks removed so you can see the cross track stray light.