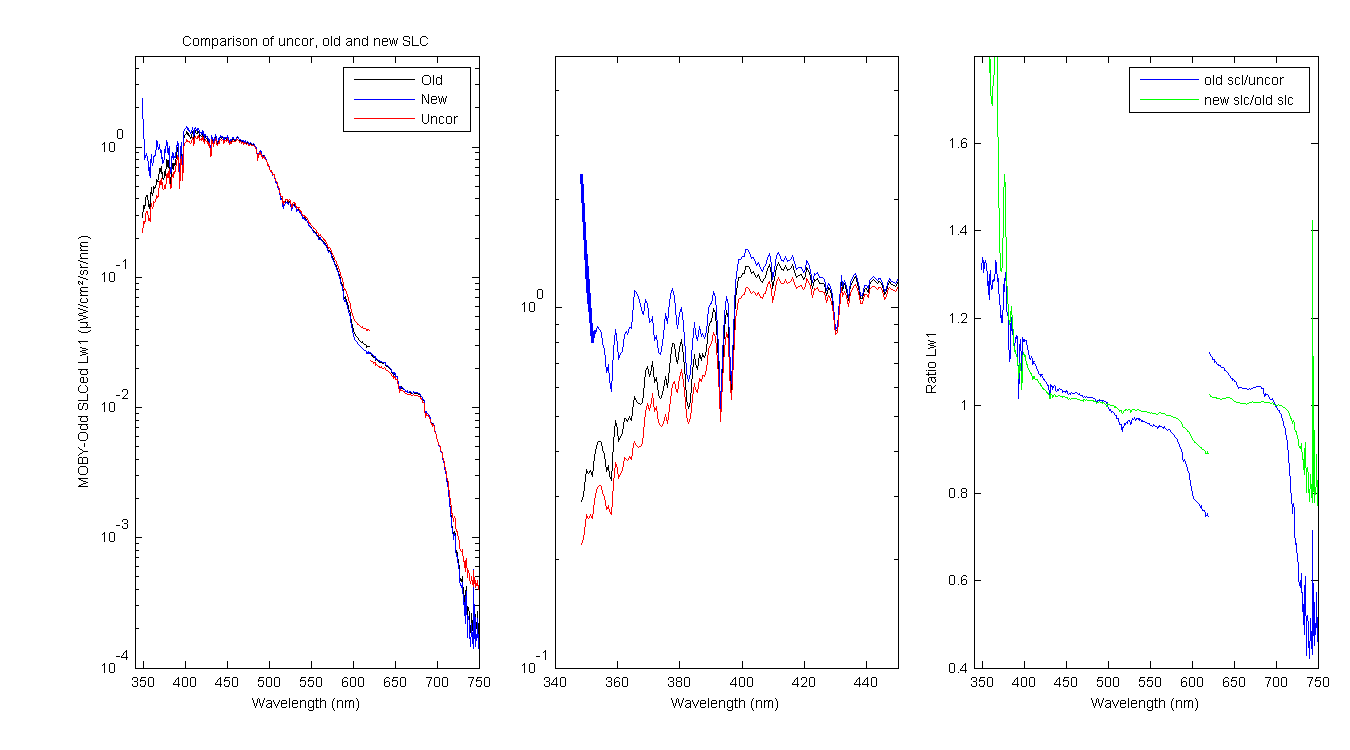
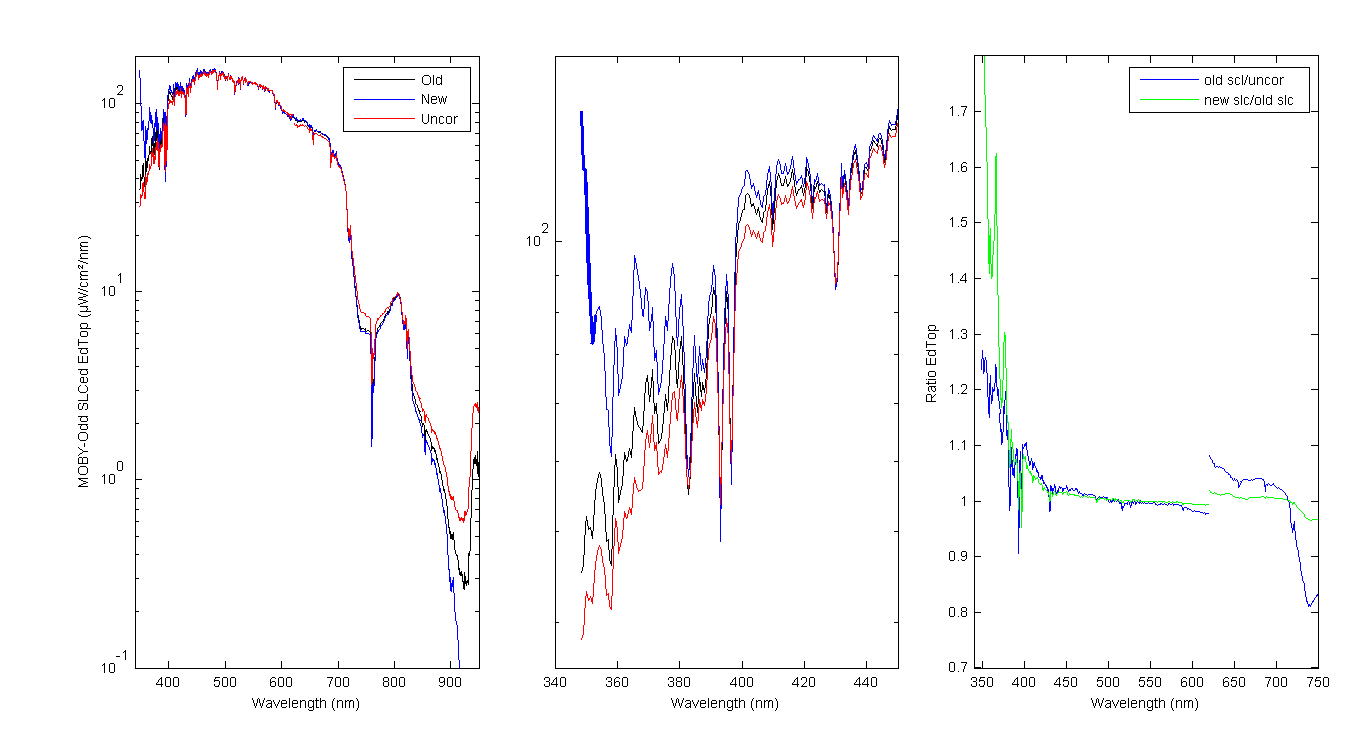
Once the final stray light matricies were complete. I applied them to a few deployments and it was clear there was a problem with the first few pixels on the blue spec. Without validation it is impossible to say how many pixels are affected. But just by looking by eye it looks like at lest the first 10 pixels have a problem. When comparing the spectral shape of the new MOBY SLC with MikeO's hyperpro data the shapes compare very well but Mike O's data ends at 353 nm, right were the MOBY data turns up. Assuming the upturn is not correct then we need to determine where the problem is coming from. Ie what part of the SLC matrix needs correcting.
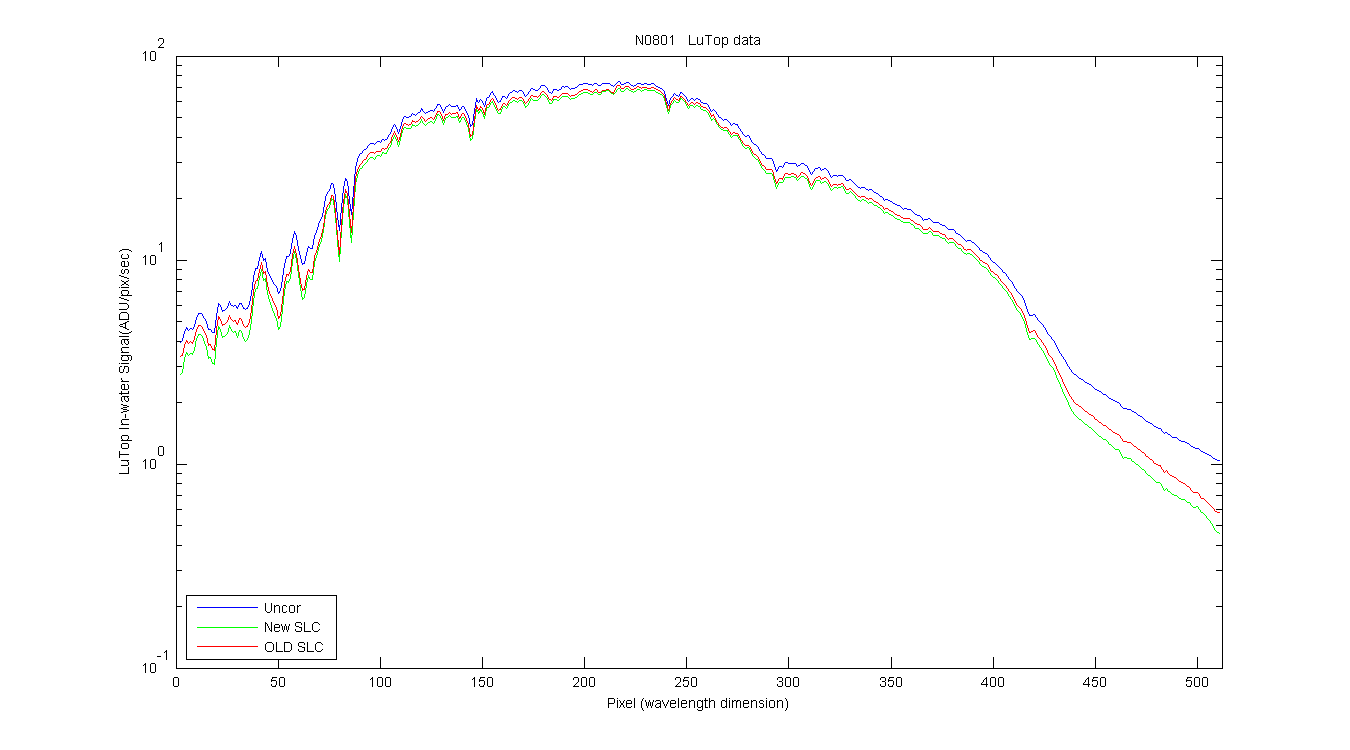
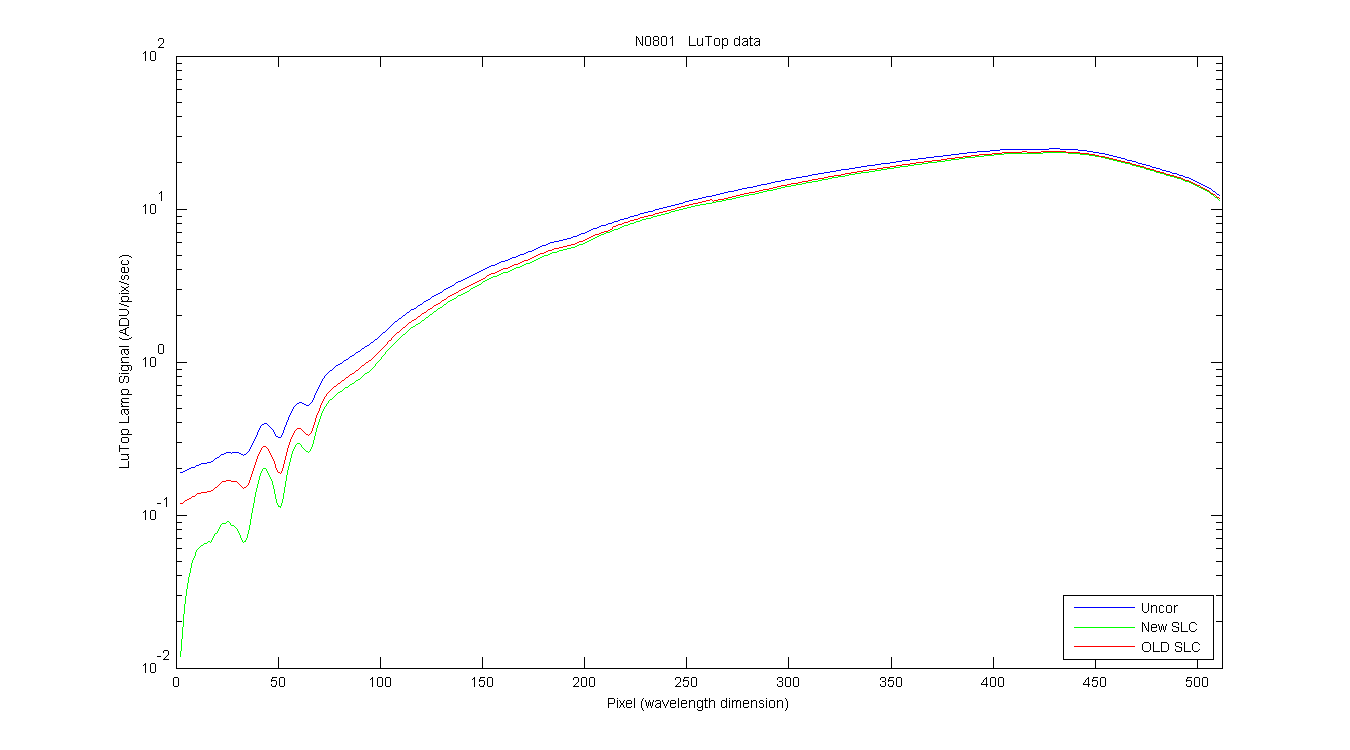
The problem seen in Figure 1 is the converted in-water data. So it is a combination of the SLCed in-water data and SLCed lamp signal. So can you see the problem in the SLCed in-water, lamp signal or both. So figure this out I SLCed each data set and plotted the data in ADU/pix/sec along with the ucnorrected and old SLCed data (figures 3 and 4). There is not obvious problems with the in-water data. But when you look at the lamp signal the UV section is pulled down way too much.
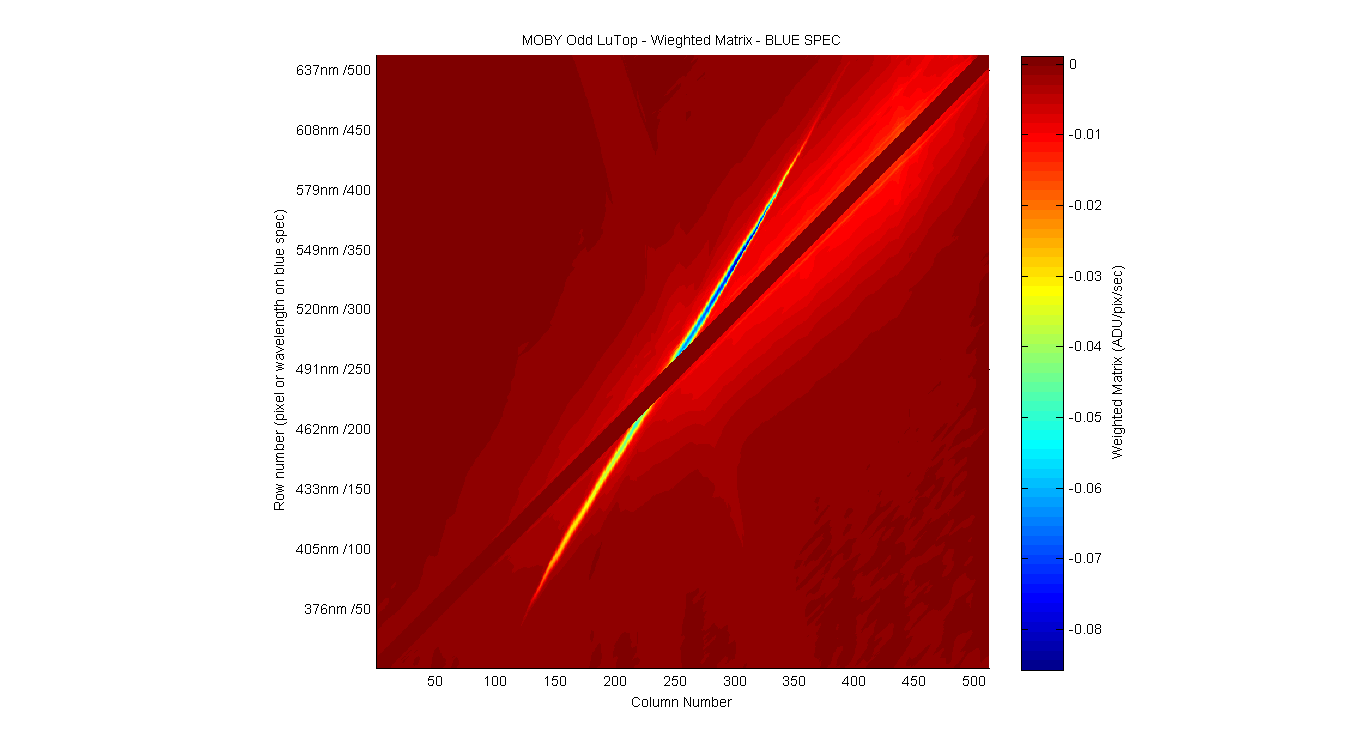
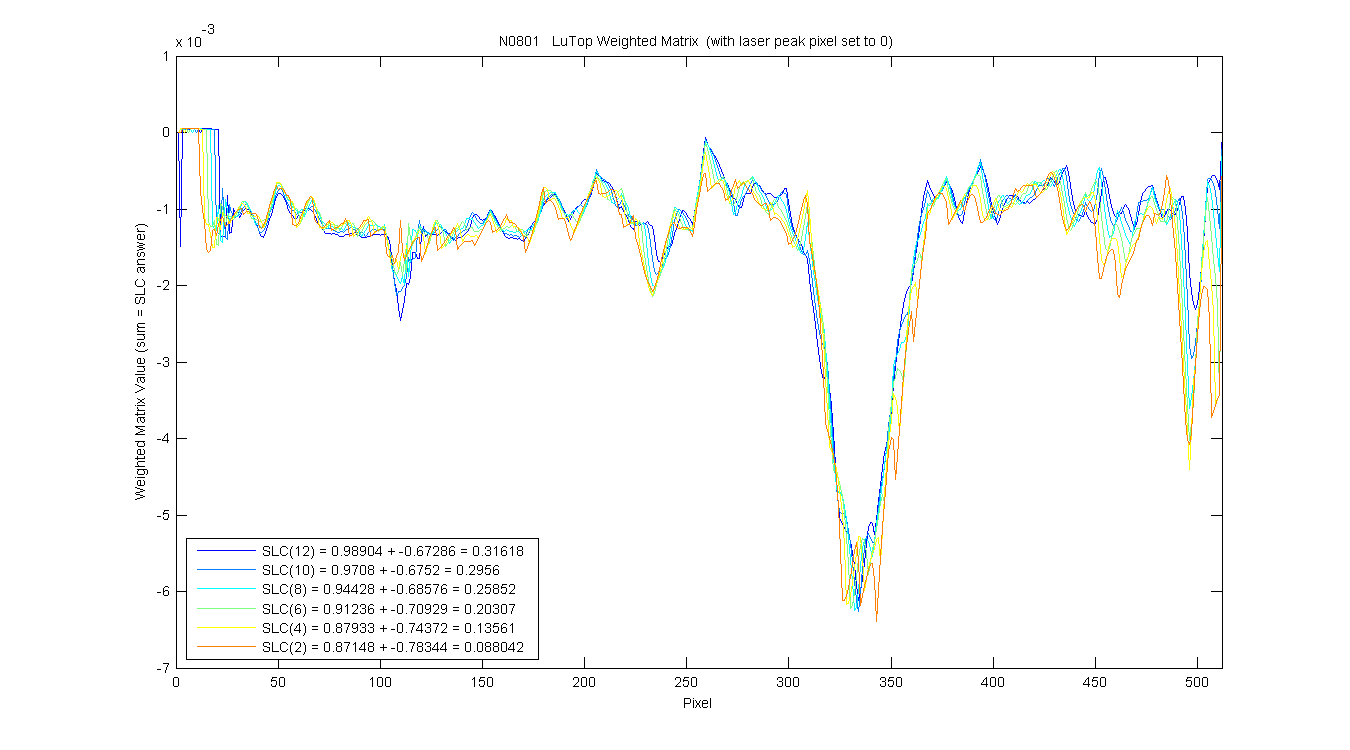
So I created a wieghted matrix (ie did the SLC manually), see figure 5. If you sum the rows in the matrix the result is the SLCed answer for that Row/Pixel. I set the laser peak pixel to zero and plotted the first few pixels to see what is causing the UV section to be pulled down too much (figure 6).
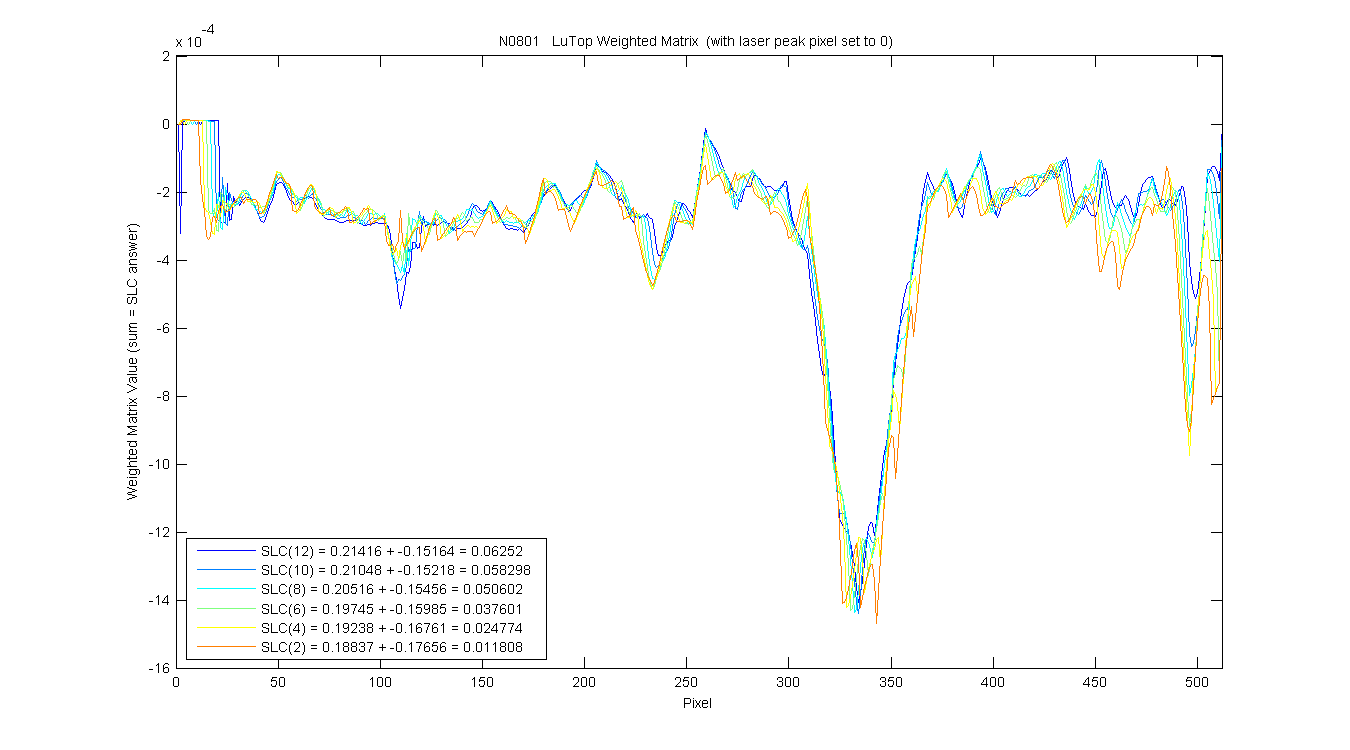
Figure 6 shows the out-of-band stray light for pixels 2, 4, 6... When you sum up these values they are equal to the amount of stray light contributed to pixel 2, 4, 6 ... from all the other pixels. The legend shows the math. For pixel 2 the uncorrected signal is 0.18837 and the straylight is 0.17656. When you subtract off the stray light you get the corrected answer 0.011808. Which is too low. I roughtly estimated the 0.01 value should be closer to 0.05 for pixel 2. This means the strylight is 0.04 ADU/pix/sec too high or about 25% too much stray light.
Final question is were is this extra 25 percent coming from. There are two main culprits. 1) the in-band area of the laser obs is too low making the stray light too high and 2) the large bump is too large. I think option 1 is less likely. We actually have laser data to very near the edge of the array with in 5 pixels (last pixel = 347 nm and laser laser obs is 351 nm). So the in-band areas are likely to be correct. I think option 2 is more likley. If I sum up the pixel 300-370 in Figure 6 the total is 0.058 for pixel 2. And we know from the removing the large bump before SLCing it has a huge effect on the UV. So the next step is to figure out which part of the large bump interolation has gone wrong.
EMAIL FROM MIKE
From: Mike Feinholz
Subject: Re: MOBY239-242 reprocessing test using new SLC matricies
Date: 5/9/2011 9:45 PM
Hi Steph,
Whilst looking at your plt_comp_rsplu.html ( and having just received new cal lamp data from NIST ) I had this thought: maybe the nUV turnup is from the system response.
DOUGH ! There it is in Fig. 4.
Now, I'm wondering if the nUV cal lamp turn-down is also evident in SLC'ed Ed/Es cal lamp spectra ? Because there is much more 350 nm Irradiance from a 1000 W FEL than 350 nm Radiance from a 35W-illuminated-sphere.
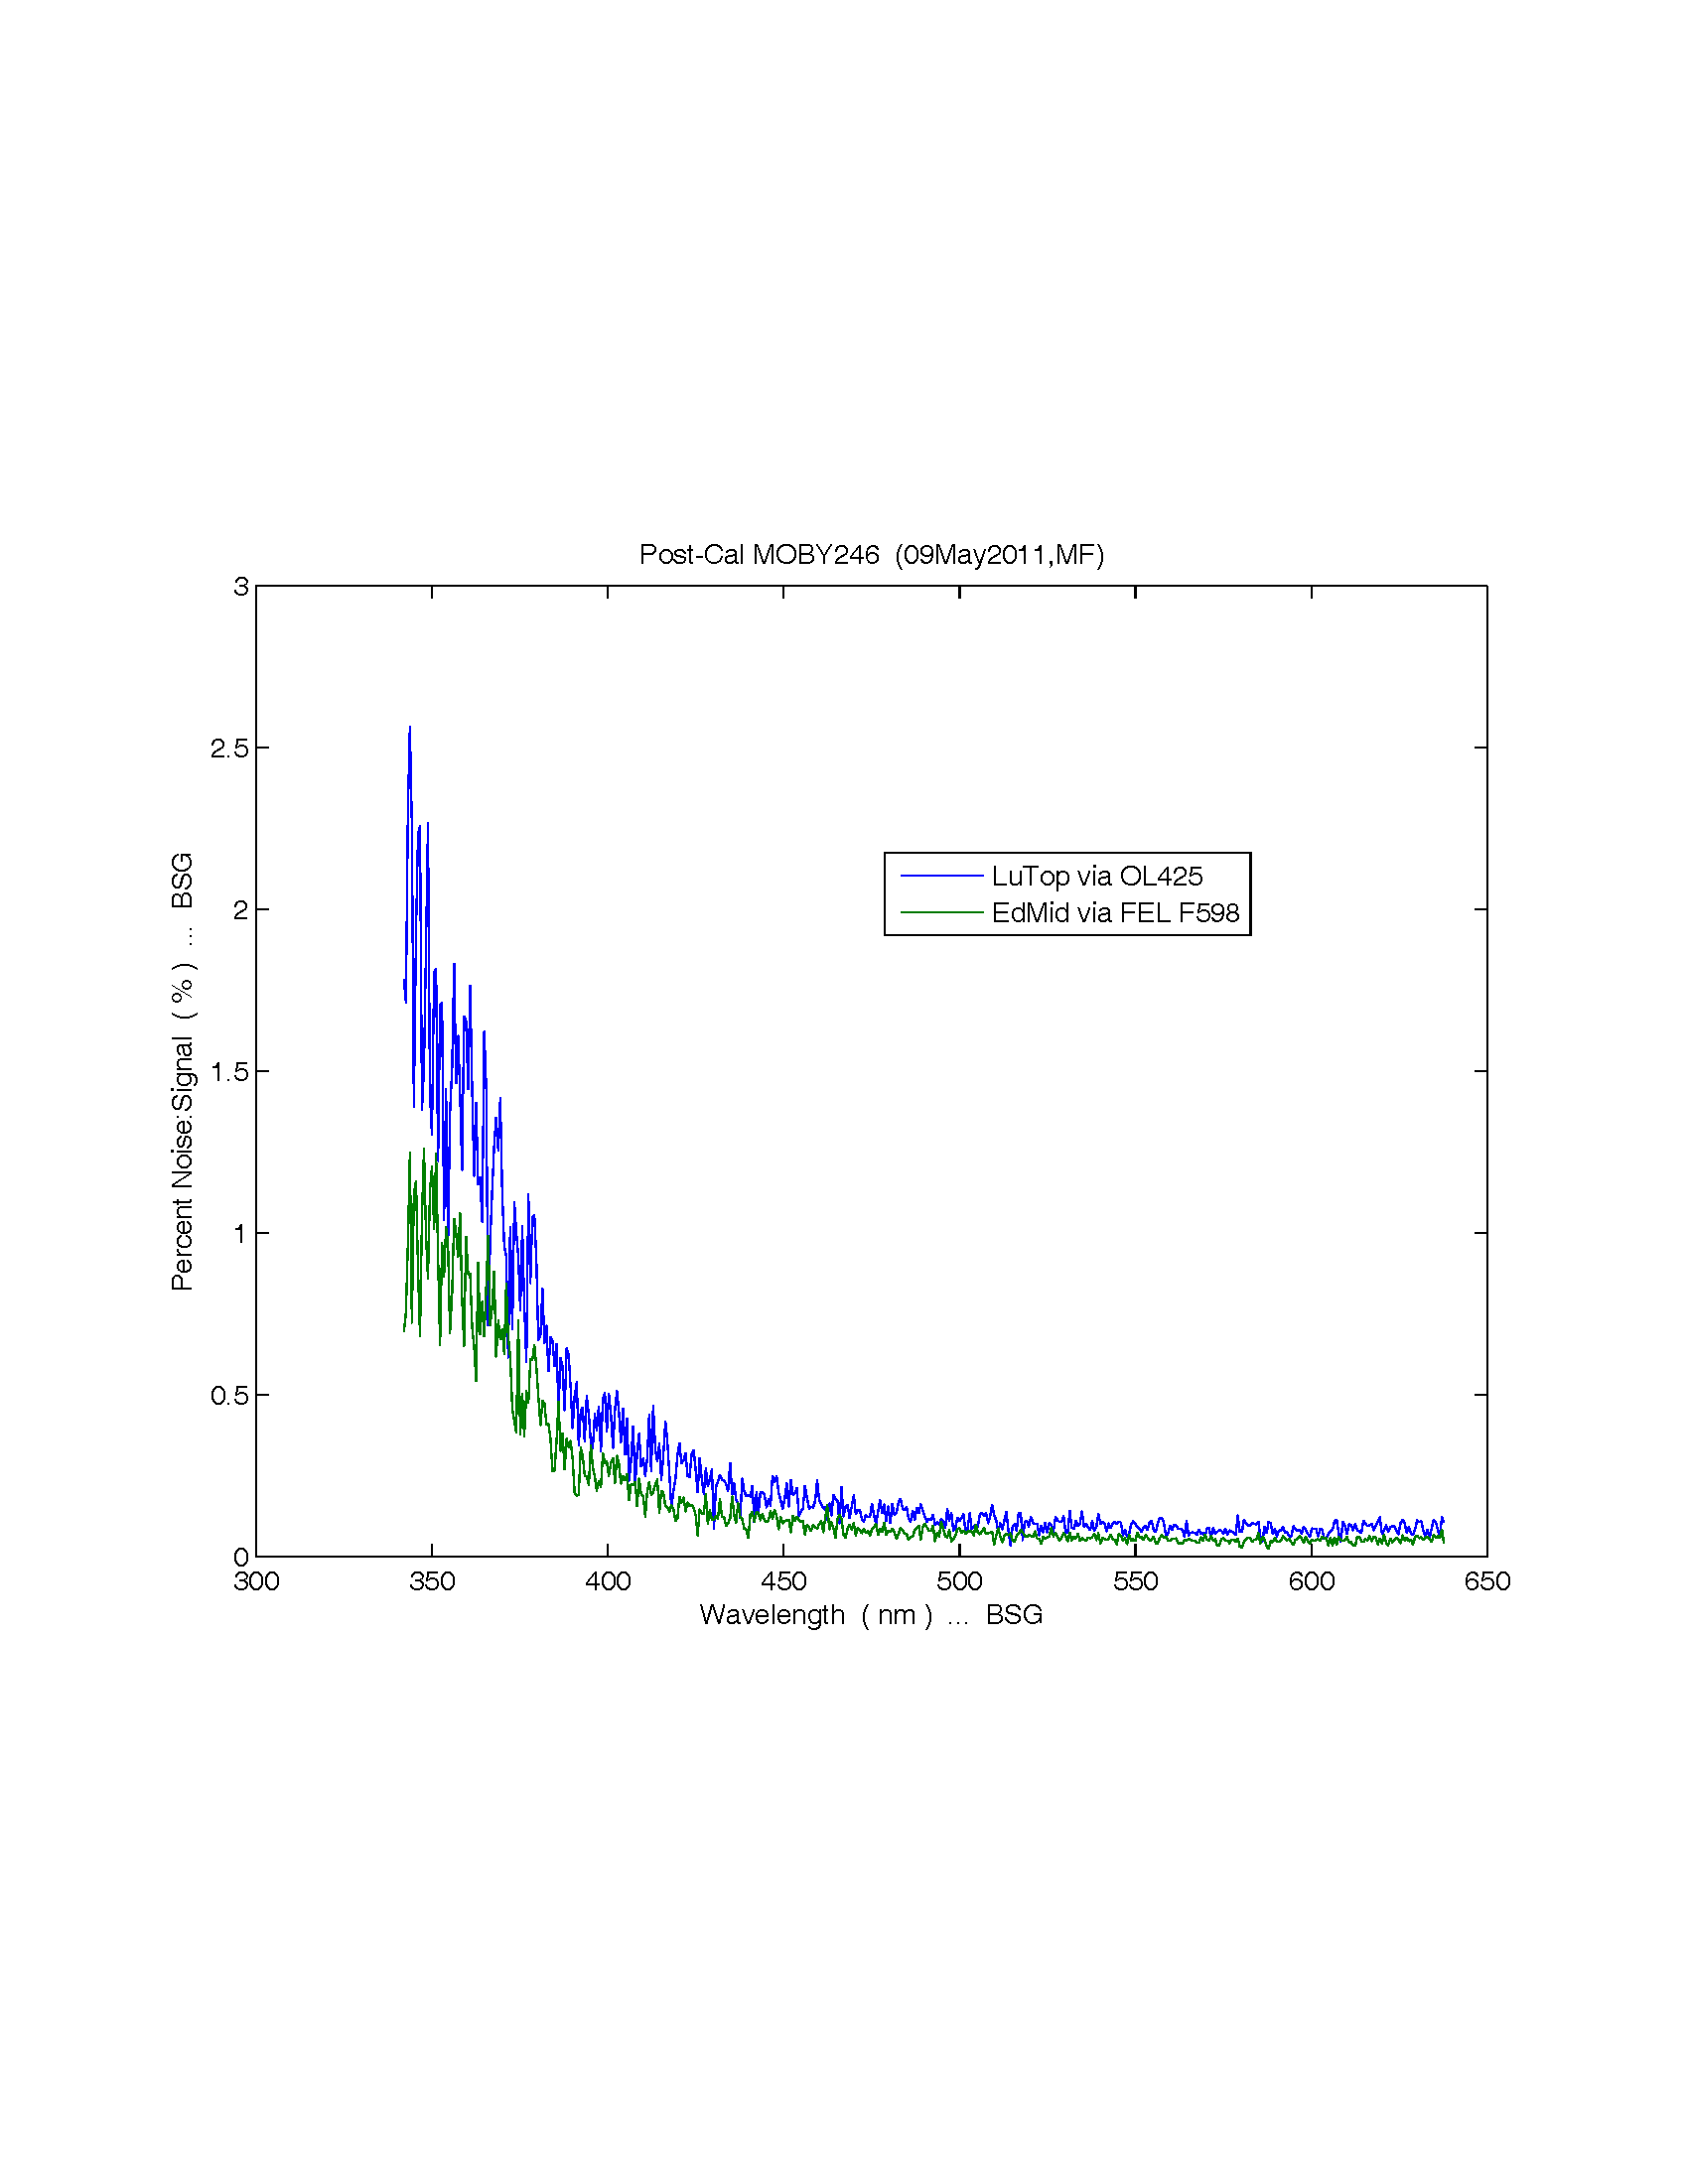
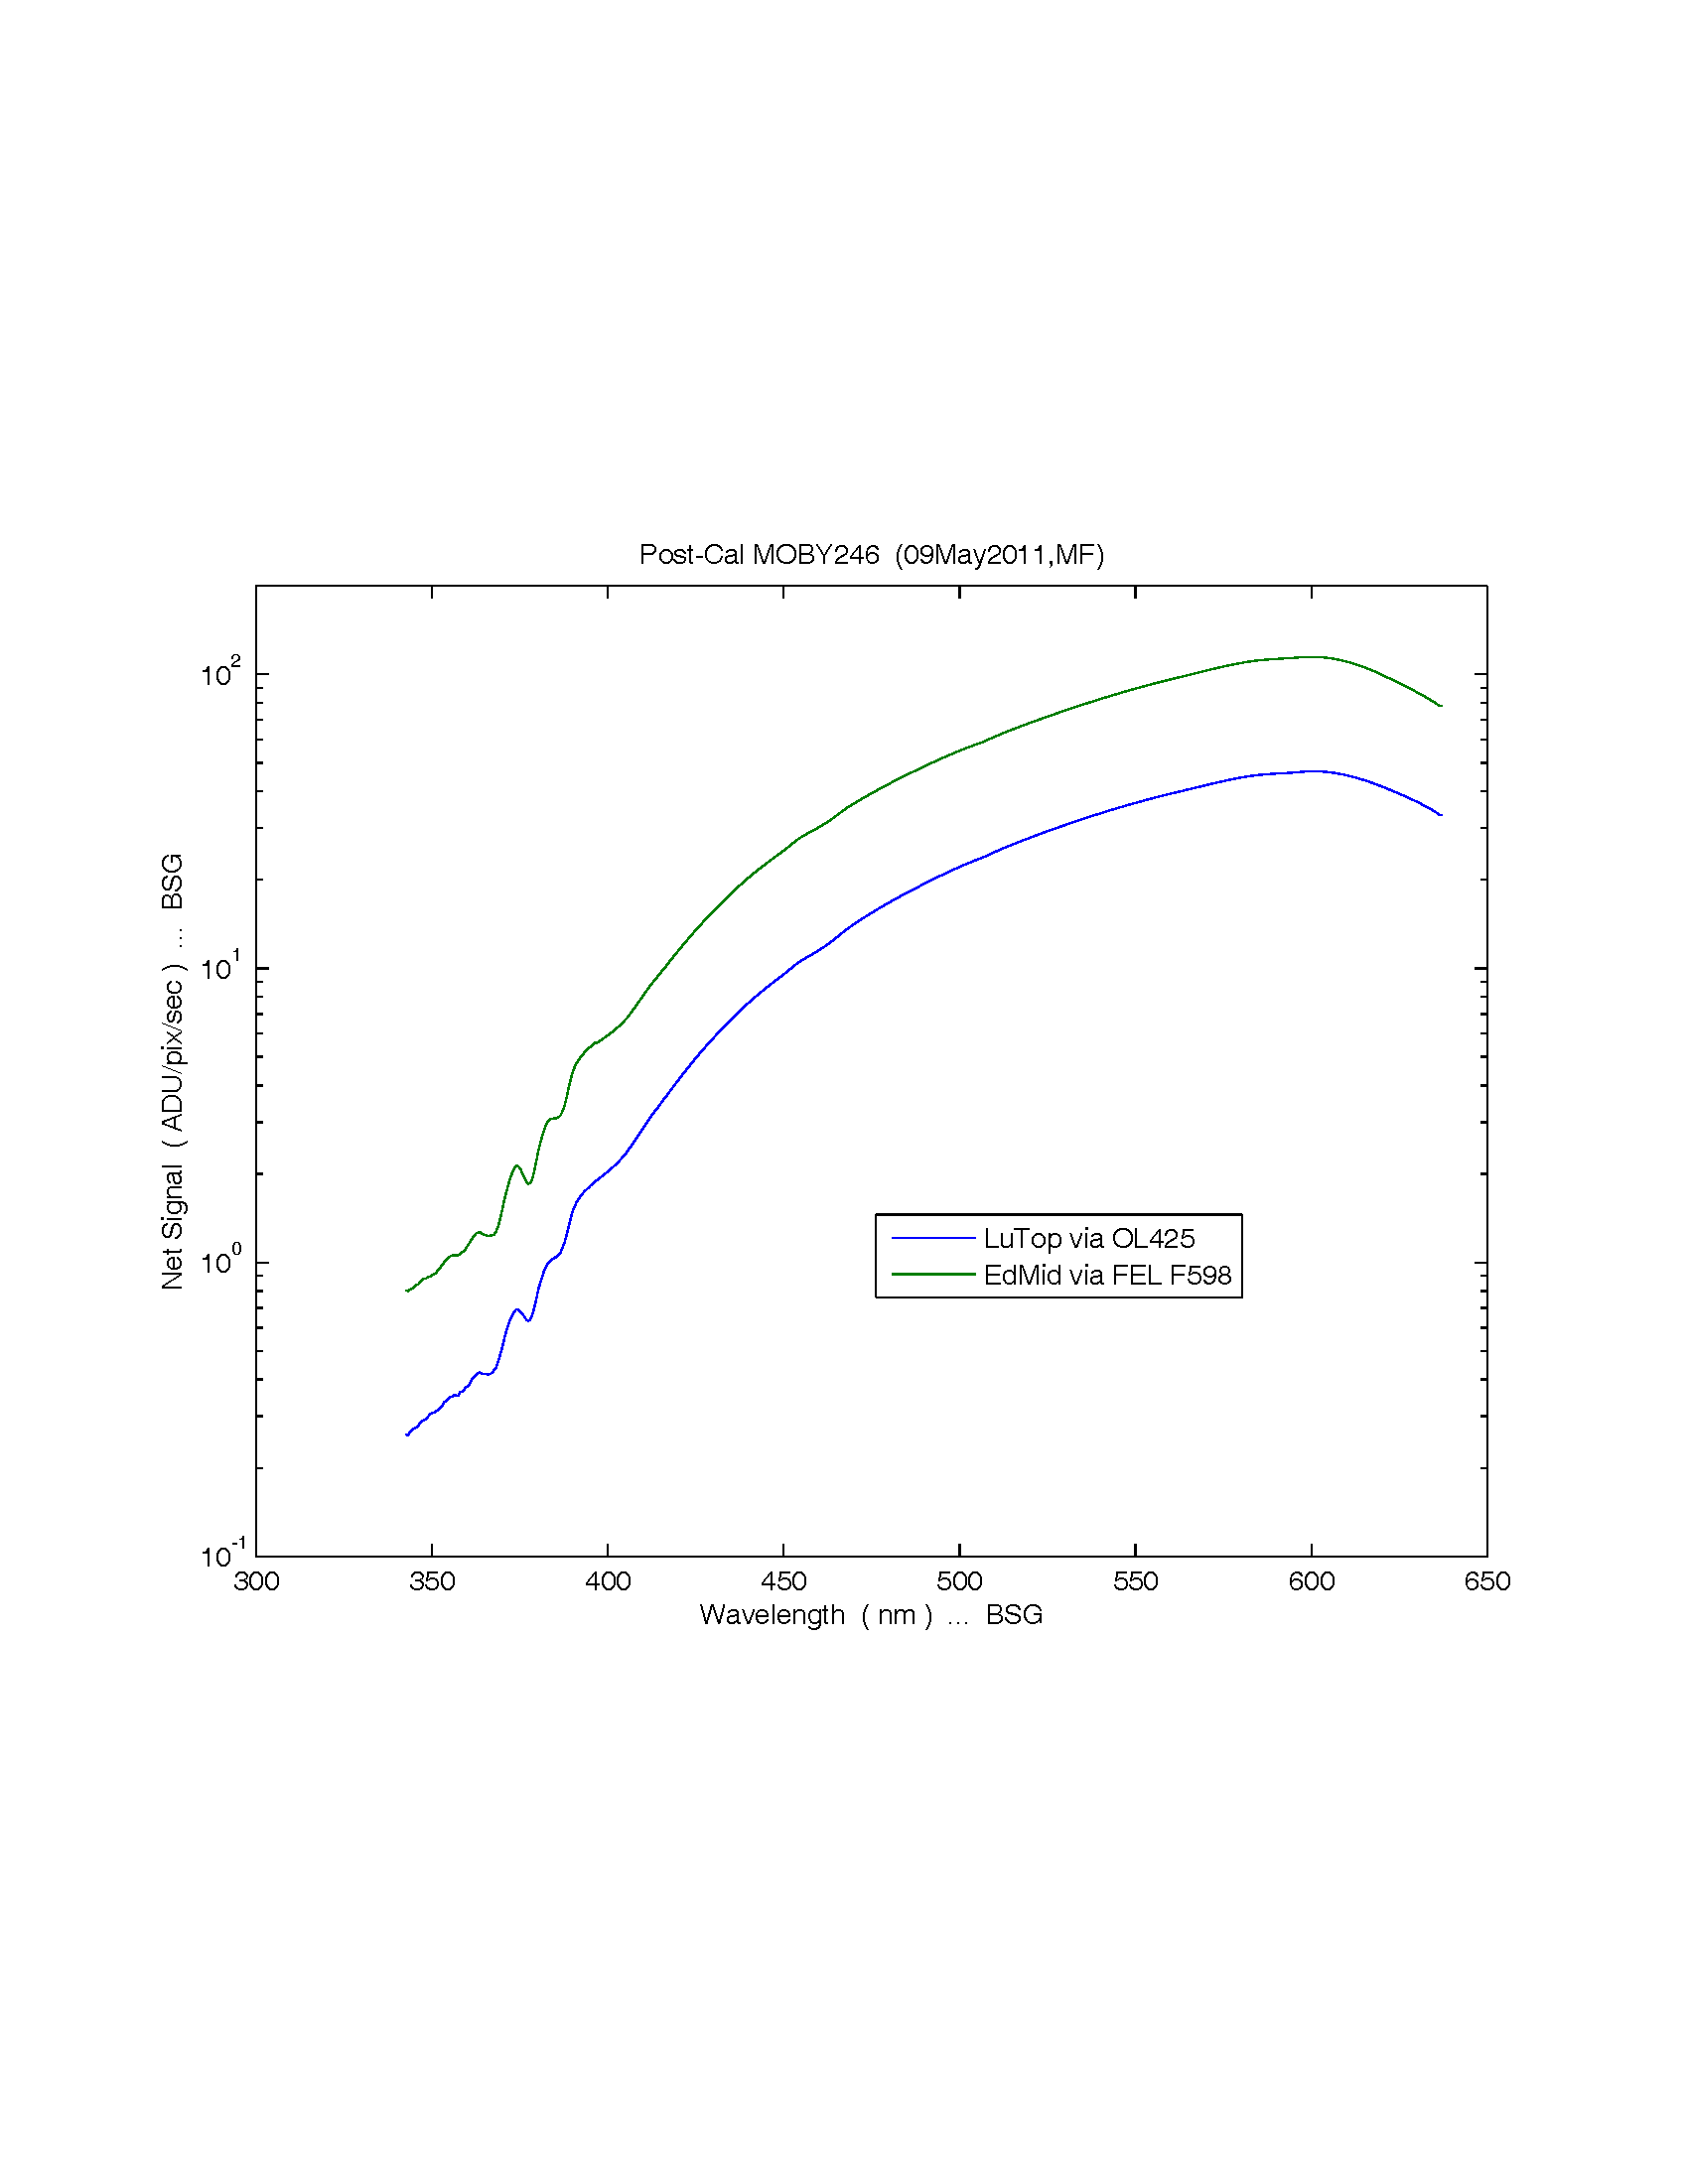
... I have to wonder if we are in the noise in the nUV ... ( see attached Percent SNR ratio and PER signal Ed and Lu) with twice as much Lu noise as Ed noise in the measured signal, on half as much ADU/pix/sec ~0.2 for Lu vs ~0.7 for Ed, in the nUV, plus a Lu cal lamp k=2 unc at 350 nm of ~1.9% for Rad vs 1.3% for Irr just makes I nervous !
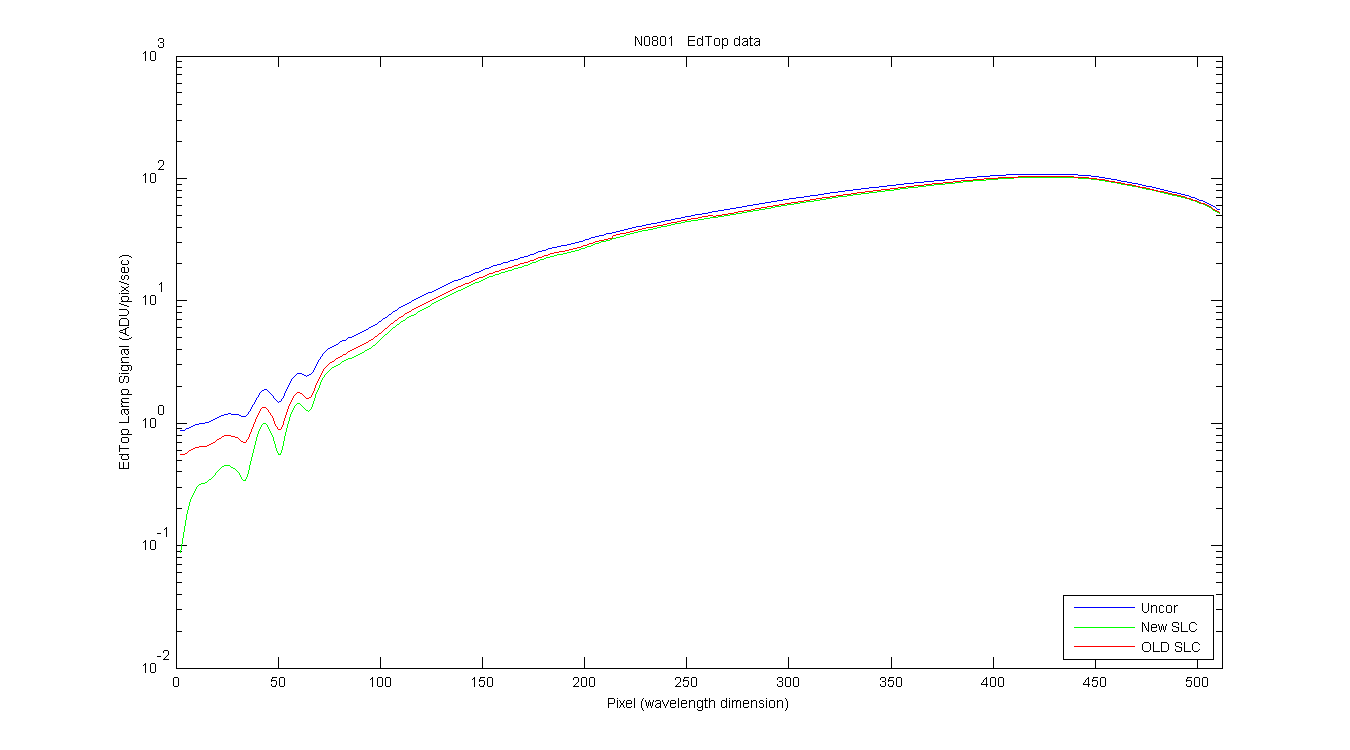
I have recreated figures 1, 3-6 for the EdTop data (see Figure 7-11). It looks like the same problem exists in the Ed data. Does this make you less nervious?? I think is means the problem is not just "in the noise"??
Also, I still don't completely understand those 6 lines in Fig.6 - are they each a row from Fig.5 ? And do you sum along each line to get the second value in the legend ?
100% correct.
It looks like most of the values for a line in Fig.6 are negative, except for the first ~20 "Pixels" which are near zero "Weight" ( this must be the zero'ed in-band ) - so are you saying: you suspect that the larger negative Weights between pix 300:370 are pulling the sum too low ?
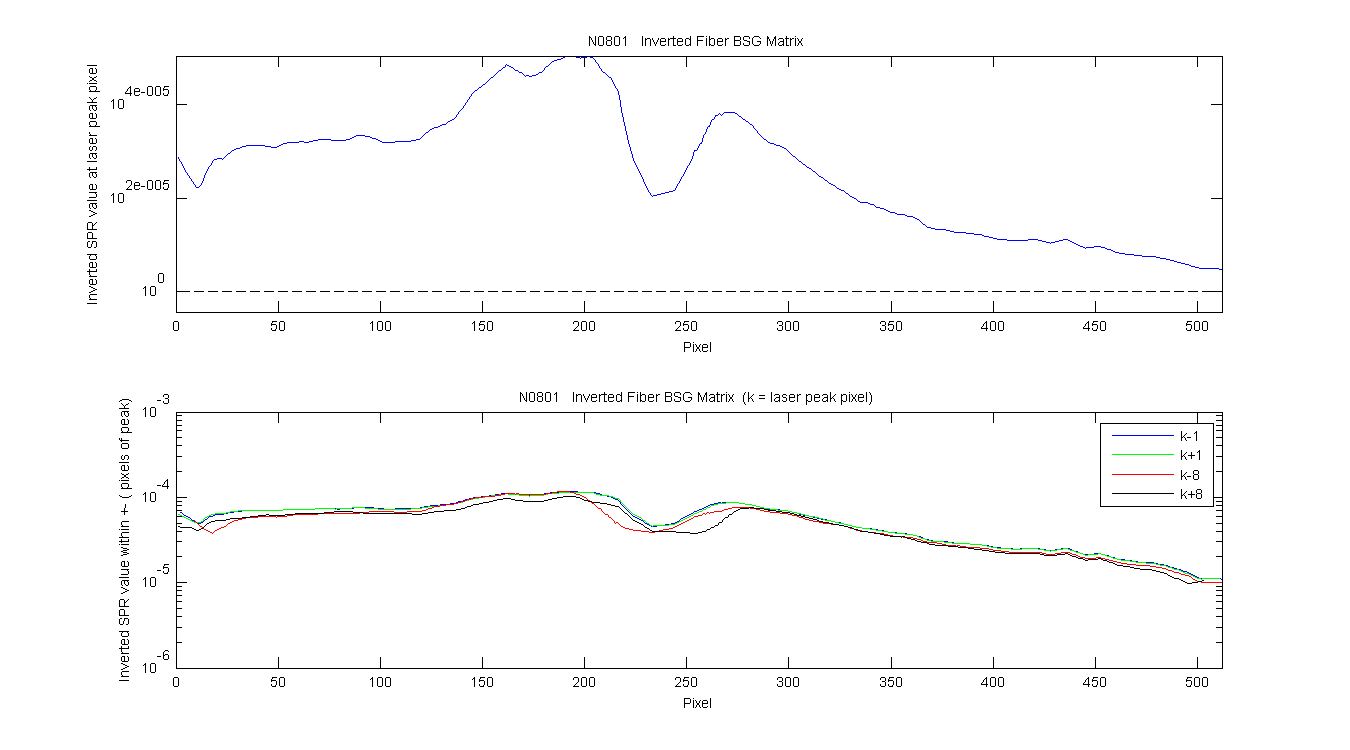
Yes, that is my working hypothesis. We know from removing the large bump that is has a huge effect on the UV so it kind of makes sense. Hopefully it will pan out. Also the first 20ish pixels are the 19 pixels set to zero around the laser obs. Interestingly when you invert the matrix these values become non-zero (See Figure 12).
MF
Graph showing the problem in the UV. The upturn is way more than can possibly make sense.
Figure 1
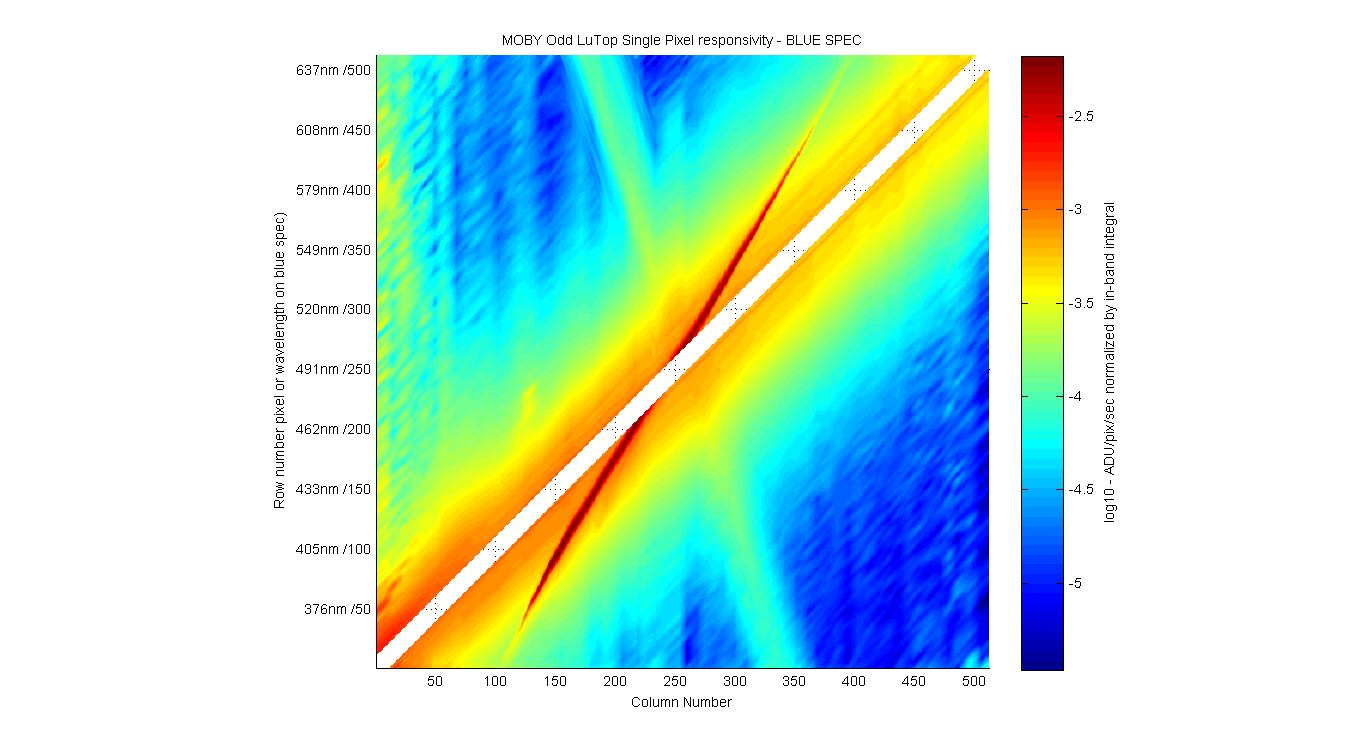
SLC matrix.
Figure 2
In-water LuTop ADU/pix/sec data SLCed with the new and old algo and uncorrected. You can see this looks fine.
Figure 3
Lamp Signal from LuTop ADU/pix/sec data SLCed with the new and old algo and uncorrected. Here where the problem becomes evident. The UV is pulled down too much.
Figure 4
Weighted matrix with the diagonal (laser peak pixels) set to zero.
Lo = LuTop signal, SPR = correction matrix. inv takes the inverse of the matrix. eye is the n by n idenity matrix and adds a one up the diagonal.
A = inv((eye(512,512) + SPR));
for k = 1:512
SPRw(:,k) = A(:,k)*Lo(k,1);
end
Figure 5
UV rows in the weighted matrix (Fig 5) with the diagonal (laser peak pixels) set to zero. The large valley at pixels 300-370 is from the large bump. These are the 2, 4, 6 ... rows from figure 5. If you sum these up you get the second value in the legend.
Figure 6
Graph showing the problem in the UV. The upturn is way more than can possibly make sense.
Figure 7
In-water LuTop ADU/pix/sec data SLCed with the new and old algo and uncorrected. You can see this looks fine.
Figure 8
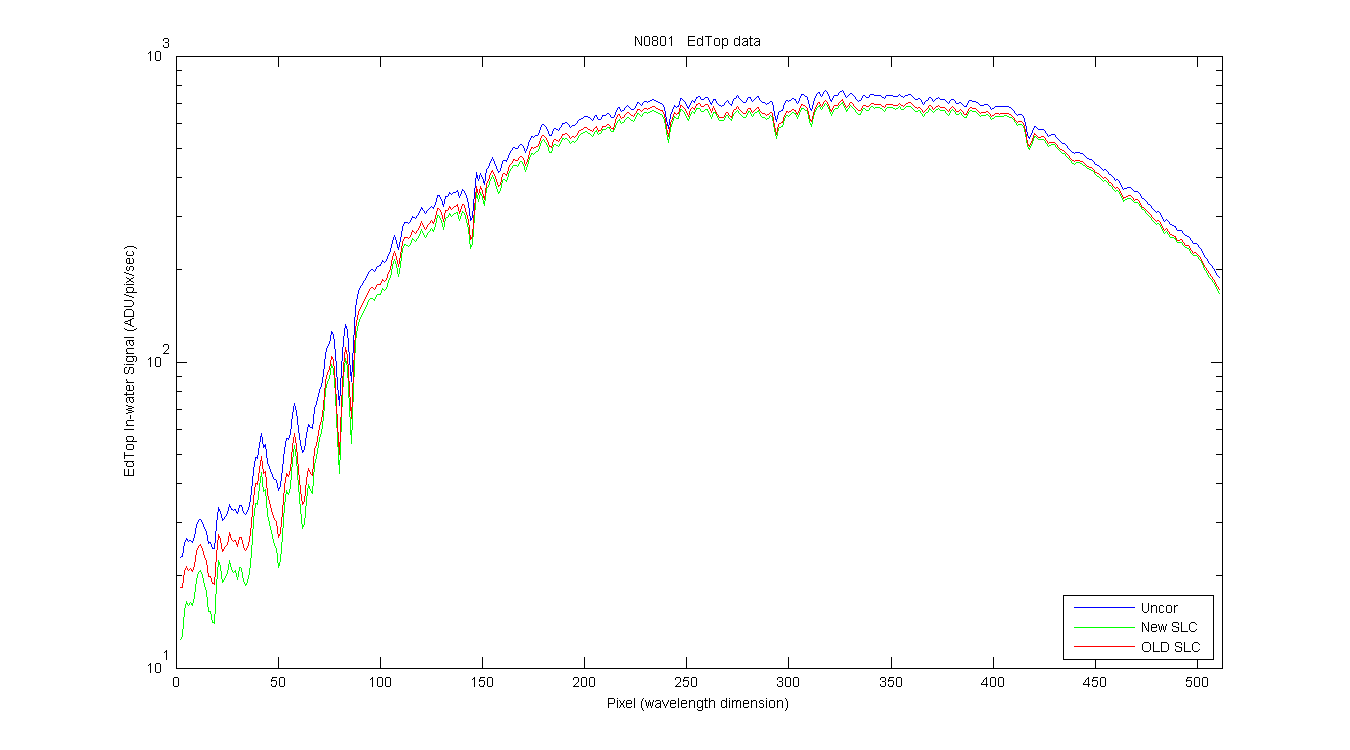
Lamp Signal from LuTop ADU/pix/sec data SLCed with the new and old algo and uncorrected. Here where the problem becomes evident. The UV is pulled down too much.
Figure 9
Weighted matrix with the diagonal (laser peak pixels) set to zero.
Lo = LuTop signal, SPR = correction matrix. inv takes the inverse of the matrix. eye is the n by n idenity matrix and adds a one up the diagonal.
A = inv((eye(512,512) + SPR));
for k = 1:512
SPRw(:,k) = A(:,k)*Lo(k,1);
end
Figure 10

UV rows in the weighted matrix (Fig 5) with the diagonal (laser peak pixels) set to zero. The large valley at pixels 300-370 is from the large bump. These are the 2, 4, 6 ... rows from figure 5. If you sum these up you get the second value in the legend.
Figure 11
This graph show the values round the laser peak in the SLC matrix after the matrix has been inverted. The top panel shows the value at the laser peak pixel (ie down the diagonal). Remember this was set to one. The value is now slightly higher than one after invertion.
The bottom panel shows the values round the laser peak. K = the laser peak pixel so k-1 and k+1 are the pixels on either side. Remember the pixels +- pixels from the peak were set to zero. now after inversion they are no longer zero. Just thought this was interesting.
Figure 12