REVISION DATE: 15-Feb-2017 09:34:54
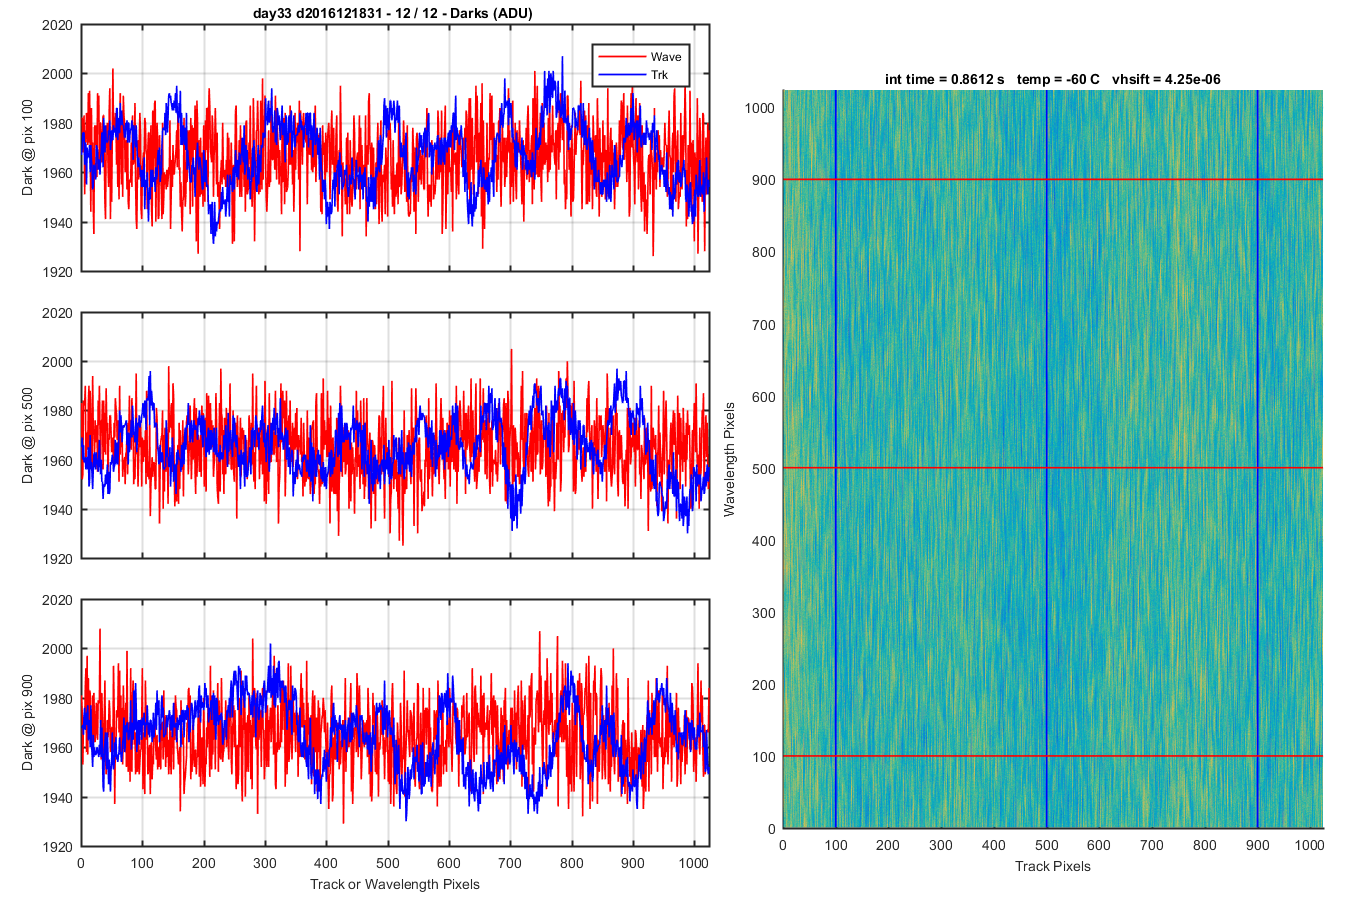
After seeing some weird darks on day 6 -999 temp data sets I wanted to see if I saw the same thing on the other dark data sets. Each graph below is for one dark file. All the dark files (d*.mat) for all DAYSXX are plotted. The title show the day and filename and the number of darks in the day X dir. The title above the image is the int time and temperature for the dark. The three graphs on the left compare the same pixels put one is from a line going north and south on the image and the other is going east to west. The three panels are the three pixels (100, 500 and 900). The red line is a dark at pixel X and goes across the tracks (red lines in the image going east to west). The blue line is the dark at the same pixel but in the direction is north to south in the image (blue lines), this is the wavelength direction. The image shows you the big picture, with the blue and red lines showing where the blue and red line on the three panels came from. Make sense?
Most of the data below look Ok. The day 04 darks have some light tracks on them. But they are VERY small and only really visible in the images. A few of the day 5 images also had tracks in the images. They are also VERY small. Day 06 is the interesting data set. The first darks which were collected with the temperature controller on and the instrument was nearly at -40C but the instrument records the temperture as -999. For the first file there is a large sawtooth pattern in the darks in the wavelength direction but in the track direction the data look more normal. On the second file the sawtooth pattern is mainly up at pixel 100 and for the thrid file it is at pixel 900. So the patterns moves around and it not always on the entire array. For the fourth file when the temperature reads -400 the saw tooth pattern goes away. But now there are large sin waves showing up in the wavelength direction. VERY odd. These large sin waves continue until the last dark file where the data looks more normal.
The very last graph is a different type of graph. In the previous images there where large sin waves in the blue "wavelength" lines on the day06 -40C data. And when looking at the image there are short "line" north to south on the images. My guess was that these "lines" are because the sine waves are moving a lot. The the last graph shows the same wavelength direction darks (blue lines in the previous graphs) but for collumns right next to each other. This for the day06 the forth dark file, temp at -40C. I am plotted the 500:505 wavelength columns. The top panel is all the lines and the 5 panels below shows each line individually. Very interesting.
Back to MOBY261 page: Main page
DAY 04, DAY 05, DAY 06, DAY 07, DAY 08, DAY 09, DAY 10, DAY 11, DAY 12, DAY 13, DAY 14, DAY 15, DAY 16, DAY 17, DAY 18, DAY 19, DAY 20, DAY 21, DAY 22, DAY 23, DAY 24, DAY 25, DAY 26, DAY 27, DAY 28, DAY 29, DAY 30, DAY 31, DAY 32, DAY 33, DAY 34, DAY 35, DAY 36, DAY 37, DAY 38, DAY 39, DAY 40, DAY 41, DAY 42, DAY 43, DAY 44, DAY 45, DAY 46, DAY 47, DAY 48, DAY 49, DAY 50, DAY 51, DAY 52, DAY 53, DAY 54, DAY 55, DAY 56, DAY 57, DAY 58, DAY 59, DAY 60, DAY 61, DAY 62, DAY 63, DAY 64, DAY 65, DAY 66, DAY 67, DAY 68, DAY 69, DAY 70, DAY 71, DAY 72, DAY 73, DAY 74, DAY 75, DAY 76, DAY 77, DAY 78, DAY 79, DAY 80, DAY 81, DAY 82,
Figure 1
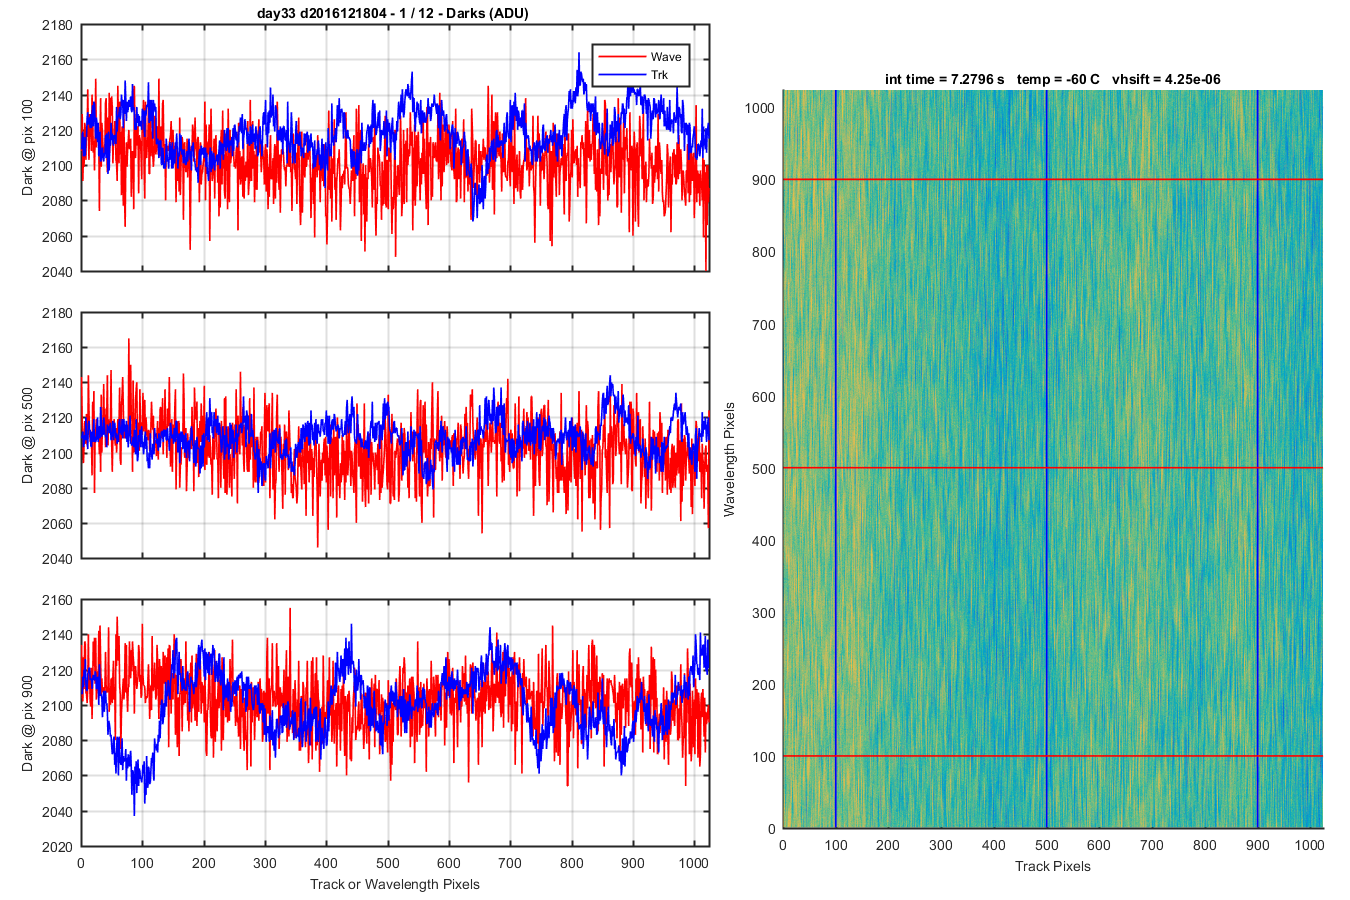
Figure 2
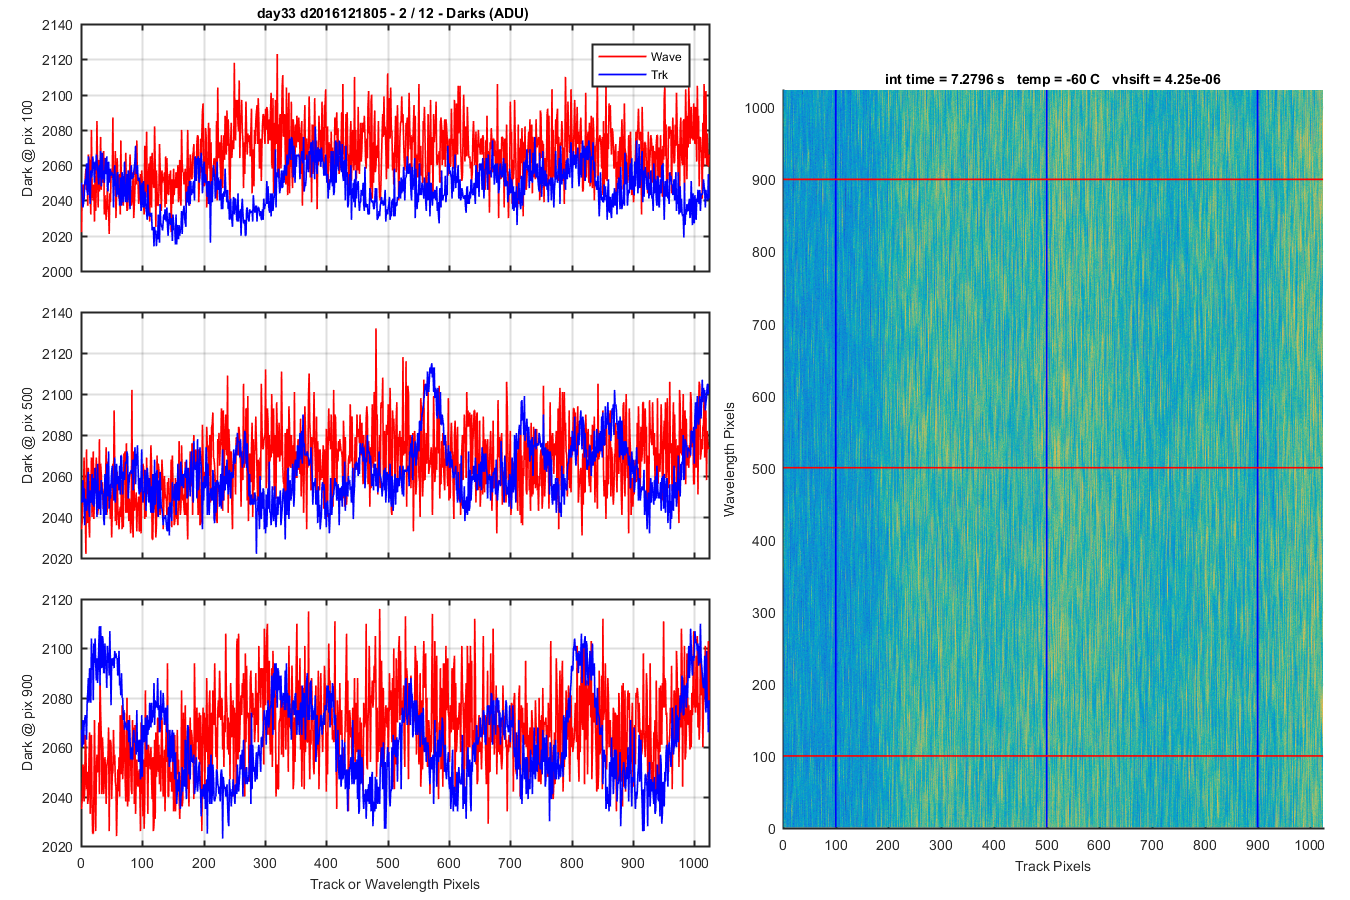
Figure 3
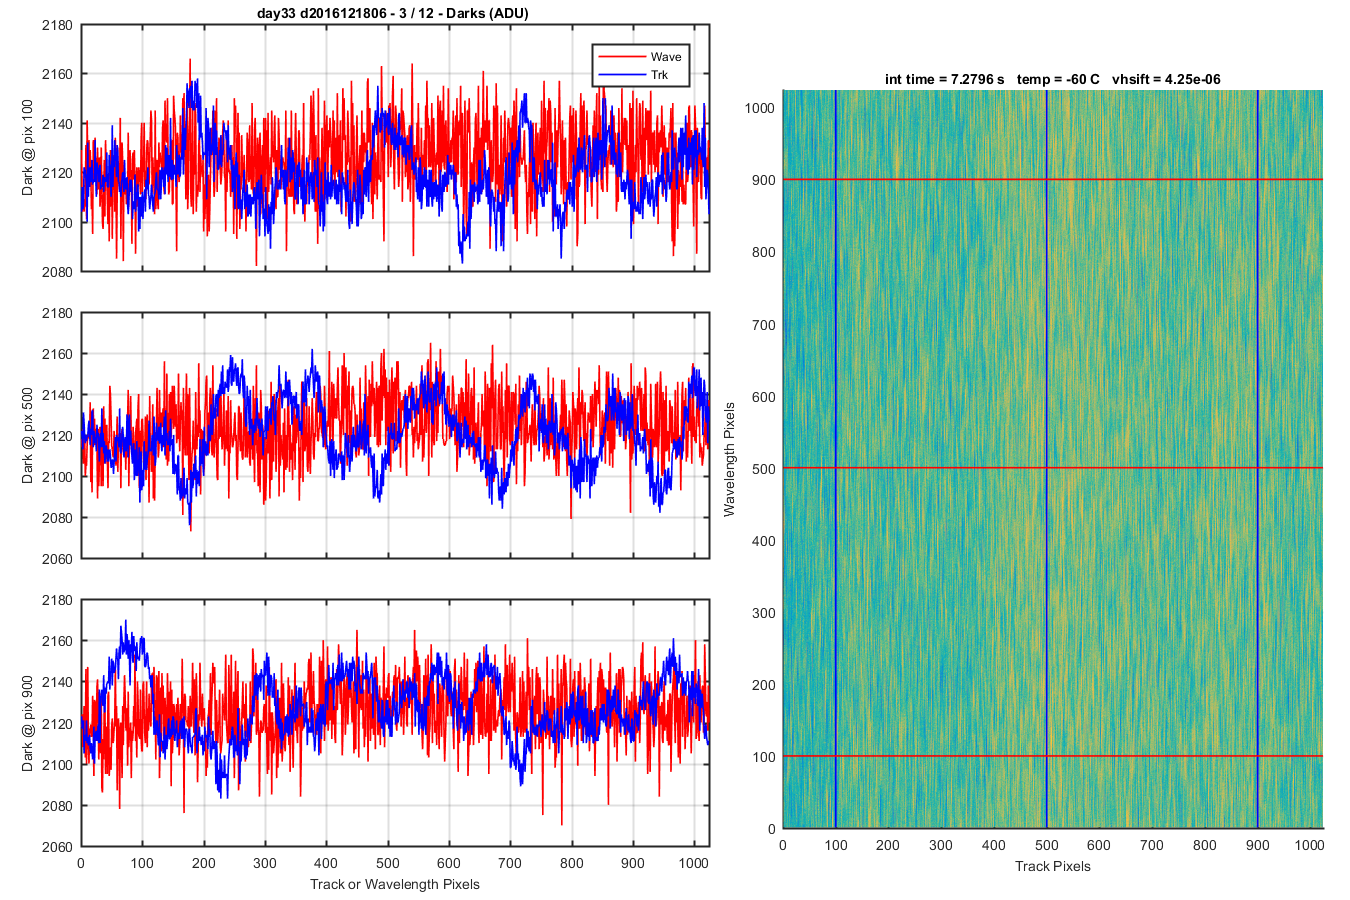
Figure 4
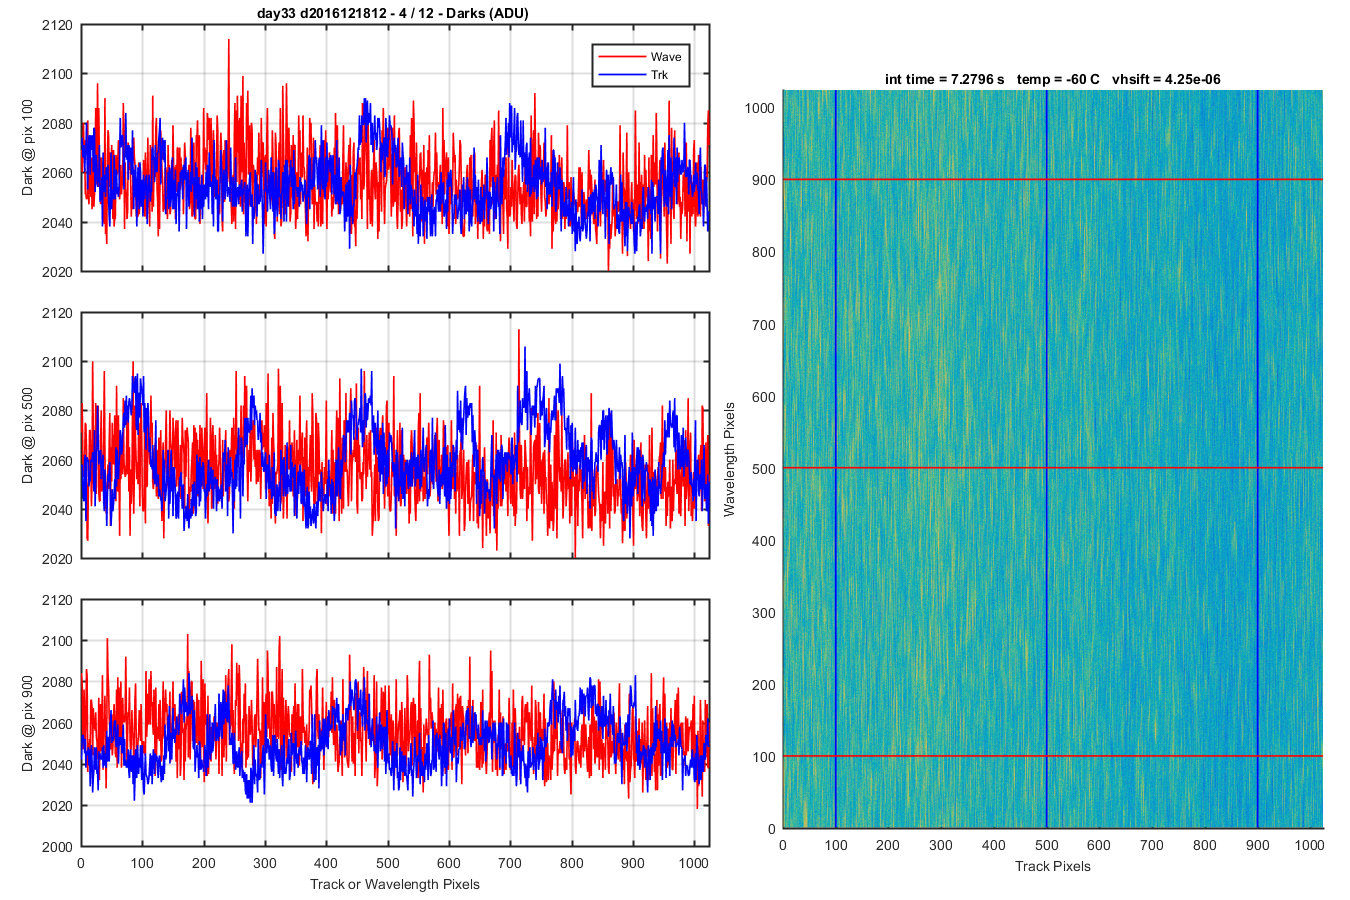
Figure 5
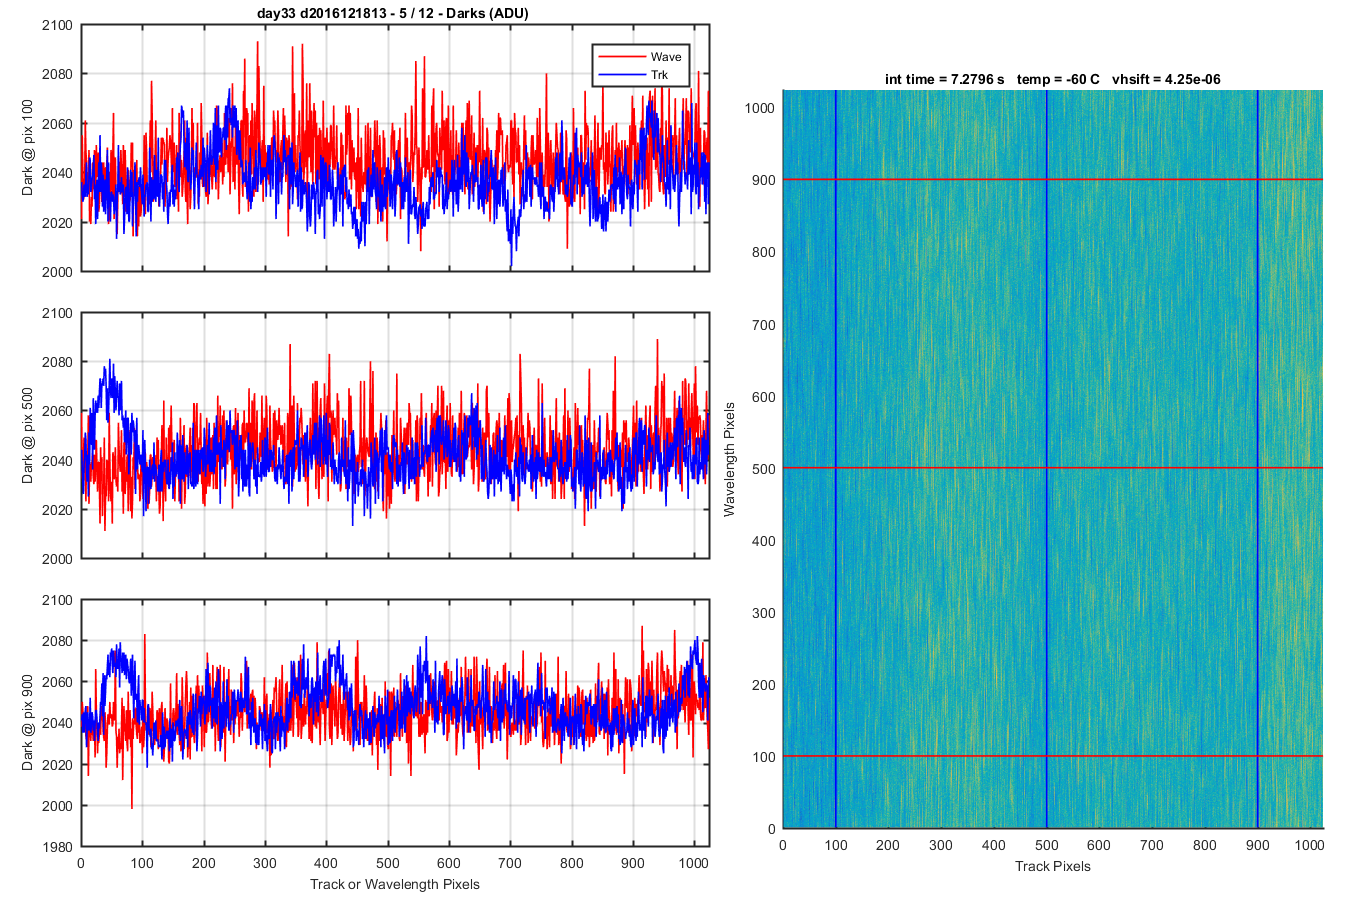
Figure 6
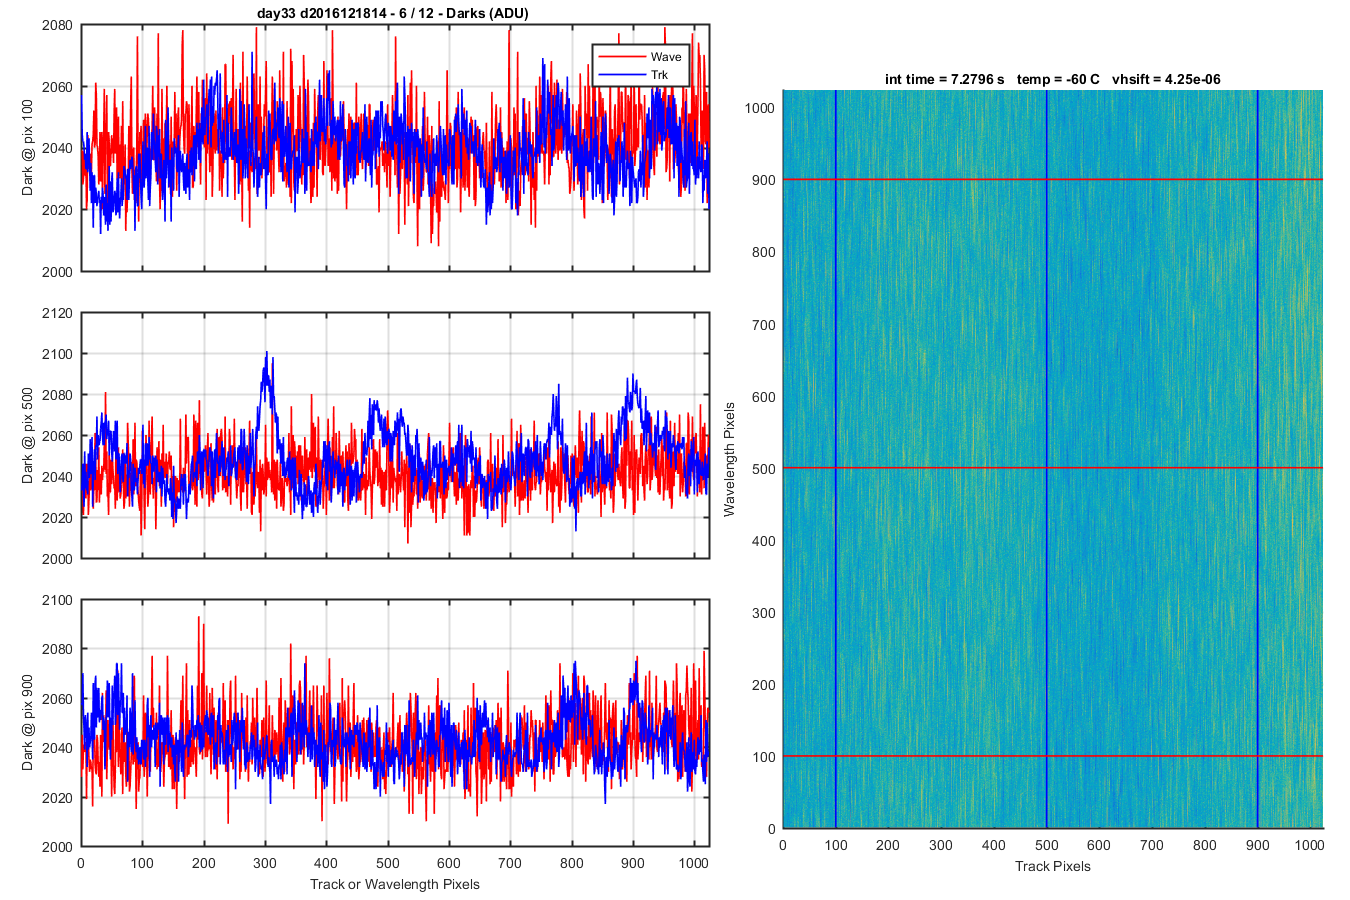
Figure 7
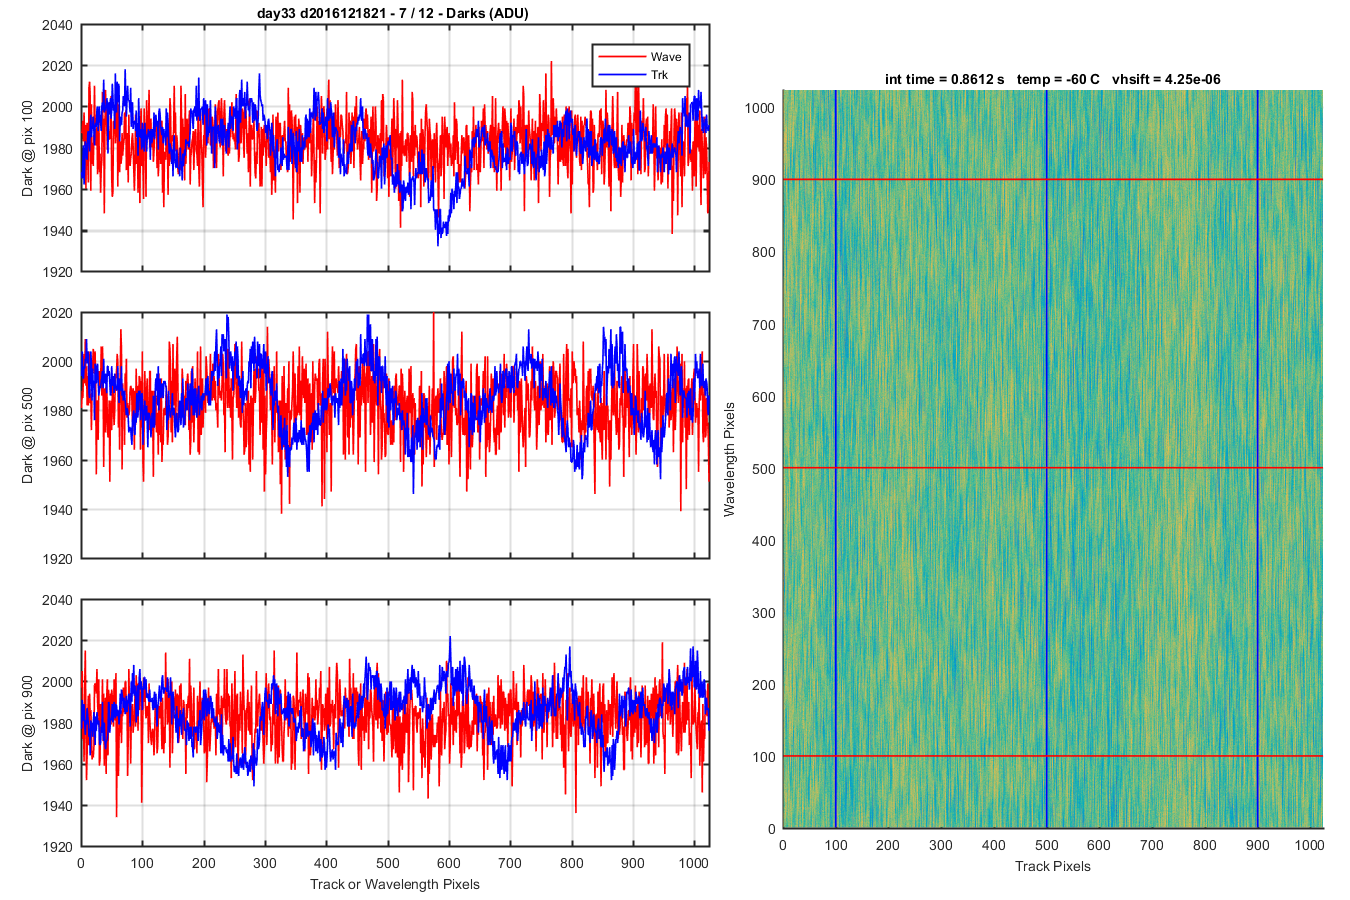
Figure 8
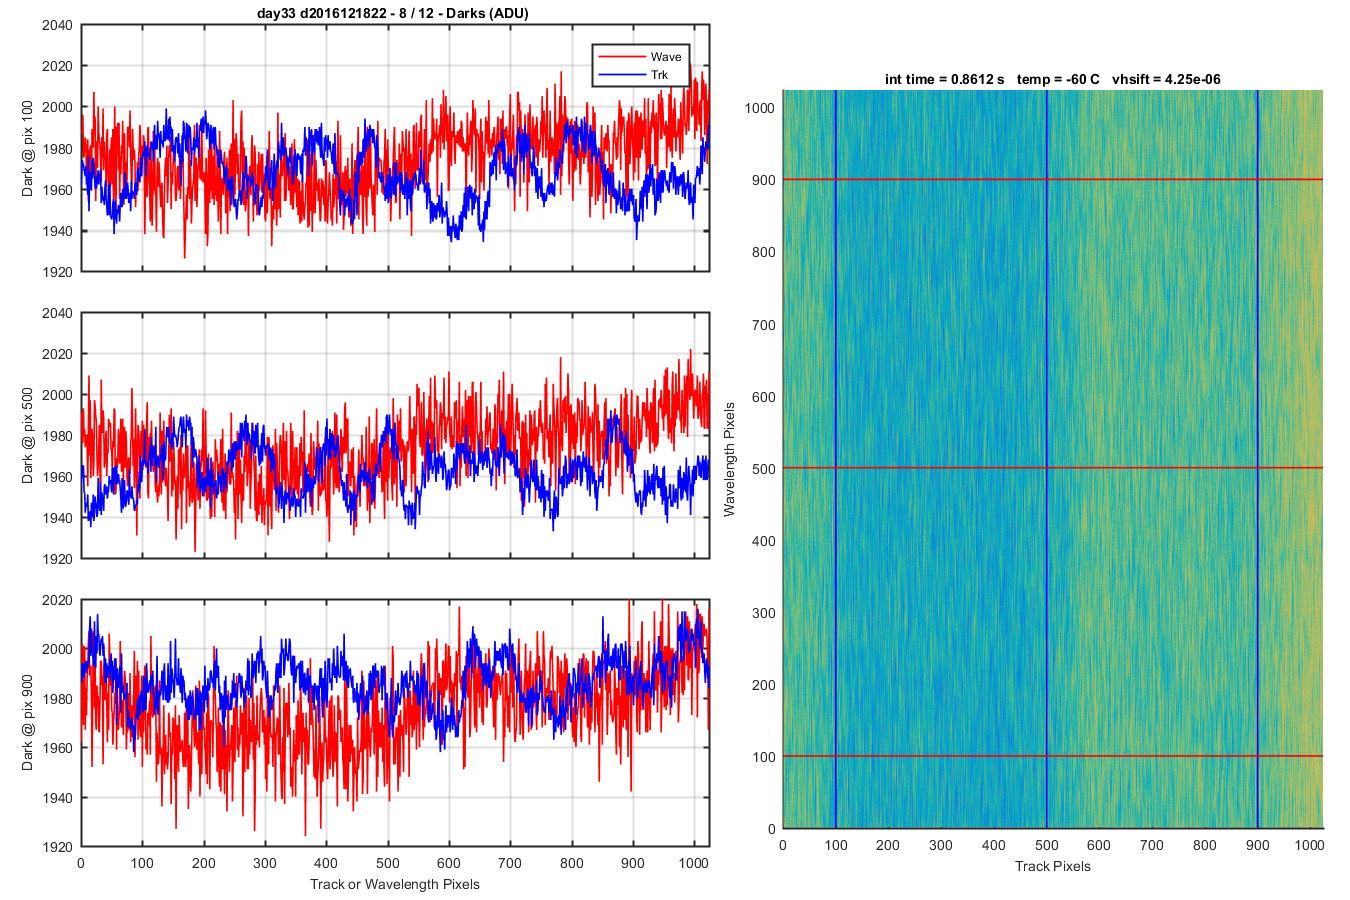
Figure 9
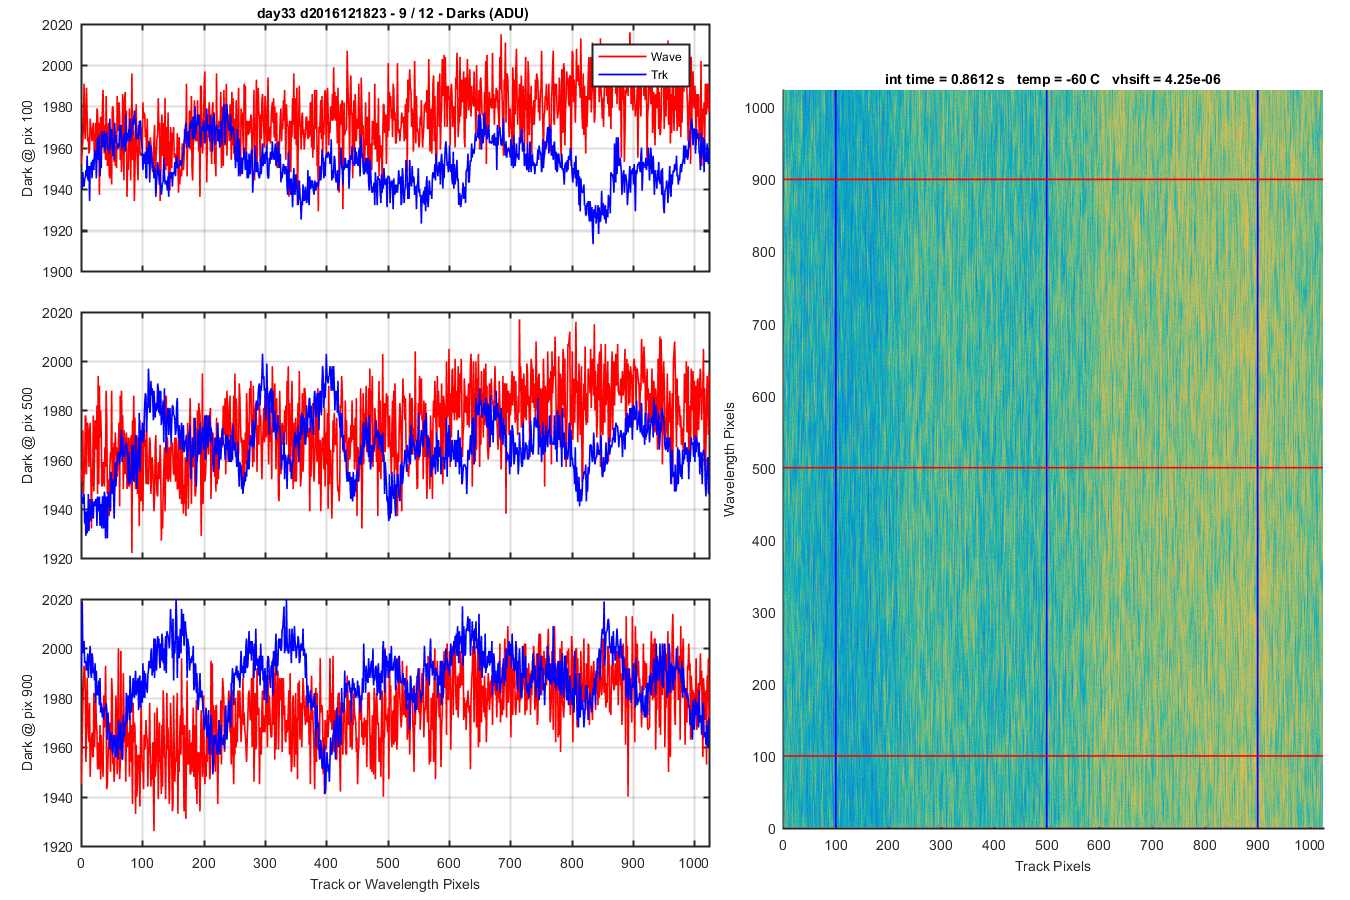
Figure 10
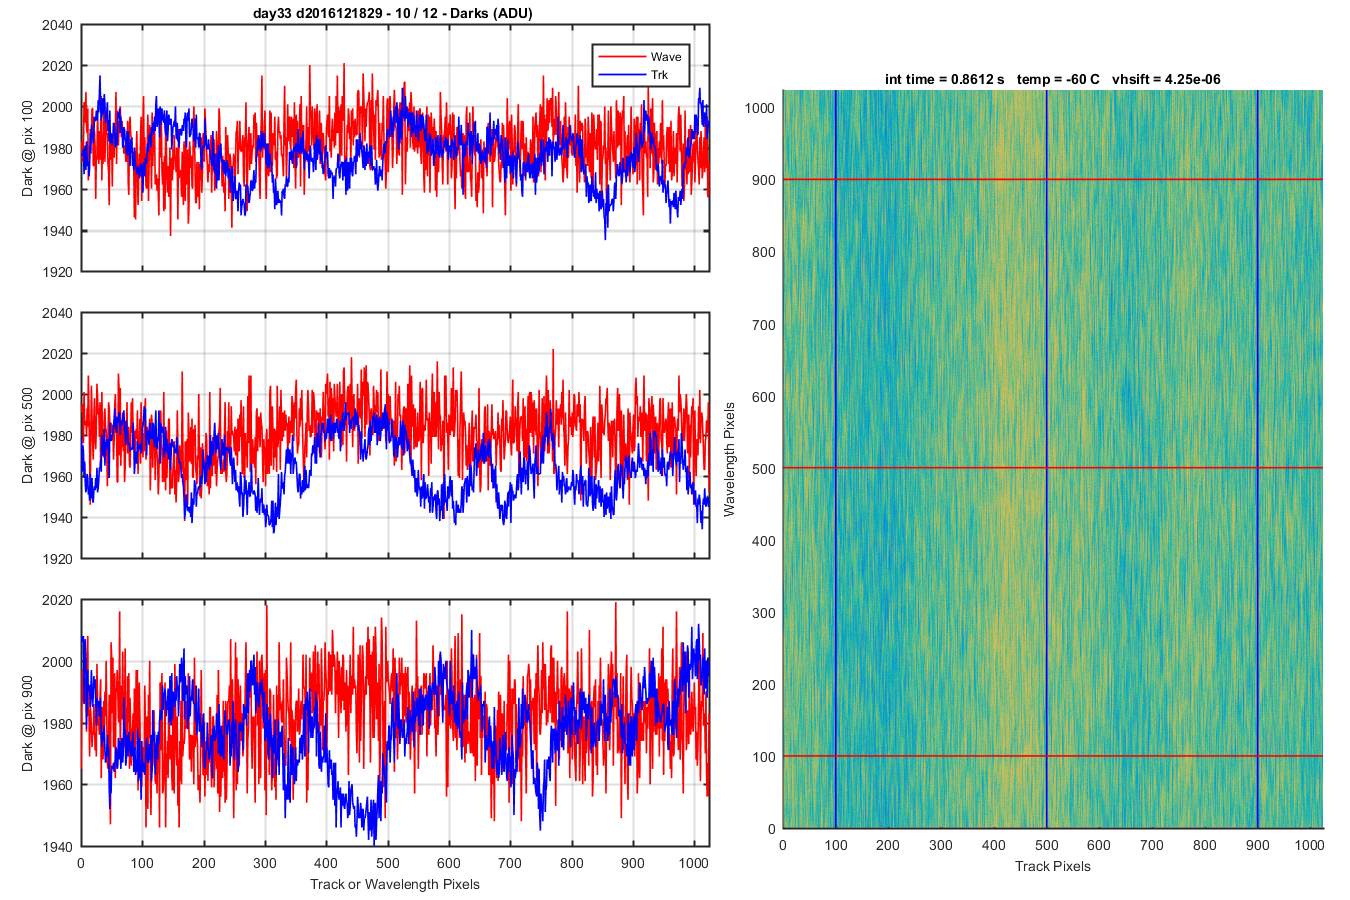
Figure 11
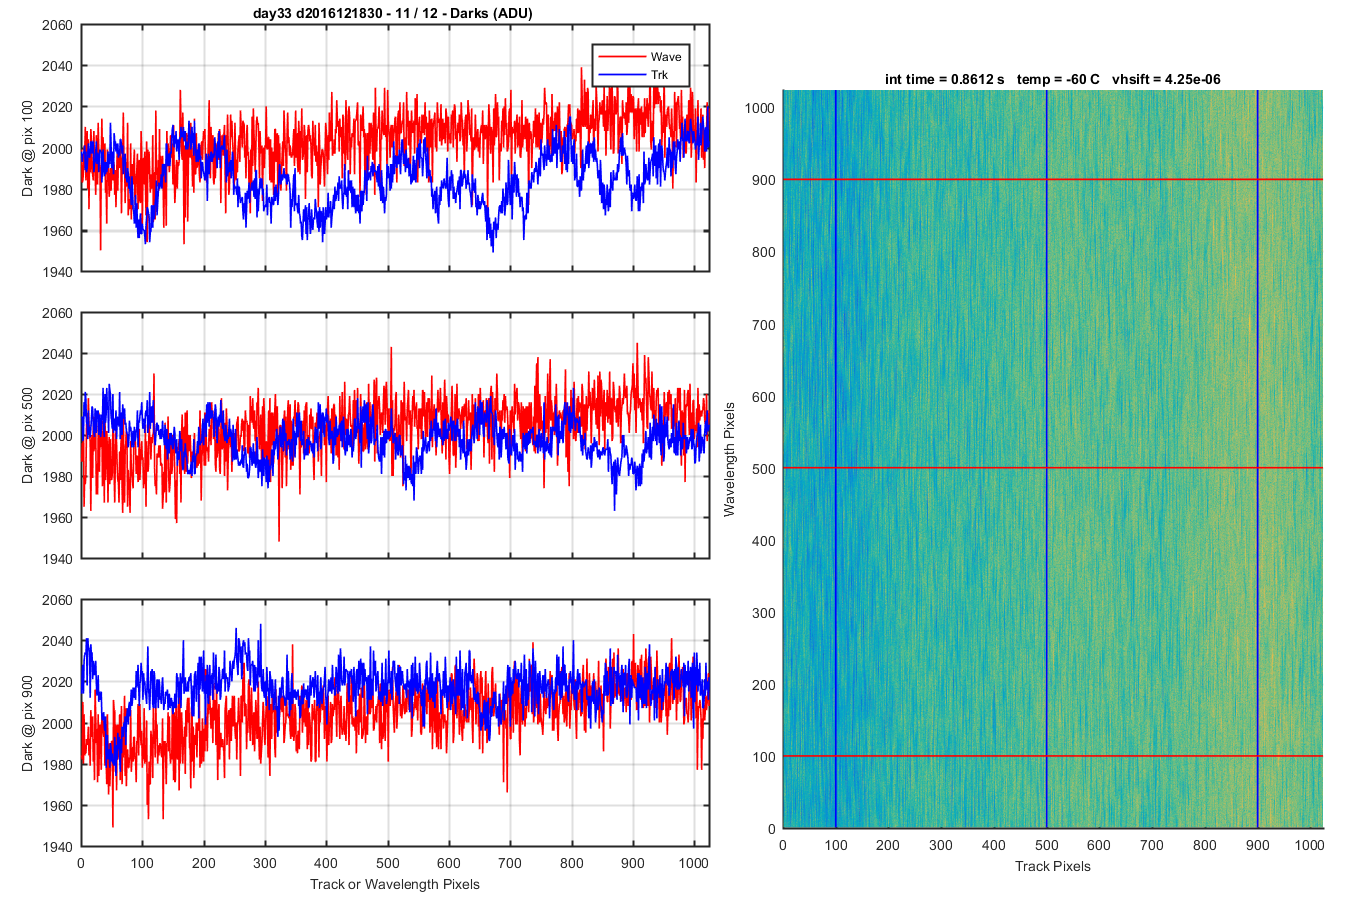
Figure 12