Hello Stephanie,
I started BS1cfg03 testing tonight, before it gets shipped to Miami.
I got the aux data acq running, and scanned Ekspla laser lines
at 350:50:650 nm via all bare FOs jigged @ sphere output port.
I kept the laser at MAX power but moved the input FO to the sphere back
away from the sphere to trim laser power and keep high-ish exposure times.
There were 2x amb scans: at 350 & 650, plus sig & bac for all laser lines.
There is one data log sheet. Data are at /ftp1/Mike/HI-2016-02/BS1cal.
I suspect you will want to compare track position of these laser scans,
compared with data from Sep-2015 HI-2015-03. I suppose it would be
nice to compare saddle shapes also, and see how the 2nd order from
350 nm looks compared to before. I don't think we had many/any
all-FO data in 2015, so the cross-track tonight could bias comparisons...
Depending upon how these data look, I think next-up should be
scans of the NIST OL455-18U sphere, to try to get a bare FO response,
and try to set a BS stability baseline before shipping. I suppose I should
probably do this more than once before the BS ships out so we can say
if it is repeatable before shipping...
Thank You, MF
Hello Stephanie,
I have the first set of OL455-18U data for thee.
There are 9x photos of the setup at /ftp1/Mike/HI-2016-02/photos.
I intended to collect data with the BS FO jig at 6 inch distance,
which was the distance MOS205cfg16 was at on 11-Mar-2016,
when MOS viewed the OL455 - hence the first couple of photos @ 6 in dist.
But 6 in would not have worked well because of the small van space and
the 2x laptops & 1x lamp controller with their poisonous screen lights.
The closest the FO jig could get to the sphere was 9/32 in, shown in
some more photos. That's where I could nicely cover the gap with a
black cloth to keep ambient lights out of the sphere. All BS data were
collected with the jig at 9/32 in from the sphere.
There is one log sheet. I collected 5x amb scans with the sphere shuttered.
Then I collected 5x sig/bac pairs. Followed by another 5x amb, then 5x sig/bac.
For a total of 10x scans each of amb,bac,sig.
The OL455 has a PhotoDiode monitor. PD output in Amps via the front of the
OL controller is on the log sheet. It was very stable. I attempted to set the
OL455 aperture - between the lamp and the sphere - so as to match the
PD Amps tonight with the PD Amps from 11-Mar-2016.
On 10-Mar-2016, post-L245, MOS205cfg16 scanned the OL425(L9)-S3W6D100.
On 11-Mar-2016, post-L245, MOS205cfg16 scanned the OL455-18U.
The OL455 aperture was set so that the sphere radiance level was close to
the level of the OL425. Then the SLC'ed & Therm-Corr'ed MOS response from
10-Mar OL425 was used to estimate the radiance of the OL455 on 11-Mar.
The OL455 avg PD on 11-Mar was 3.1923e-7 A ± 0.078% (N=6 scans) -
which was pretty close to tonights PD readings.
I am attaching here the ASCII file of the estimated radiance of the OL455: <attached: OL455-18U_rad_11Mar2016.txt>
Good Luck with this one!
MF
Hi Steph,
I repeated the 10x sig & bac + 10x amb scans of the OL455 with all bare FOs.
I did not alter the physical setup for day 03 from day 02, except to re-start the lamp.
I'm curious what was the mean & std for the sig & bac & amb (N=10) for each of the 2 runs.
I guess "we" should calculate a difference of avg(amb) - avg(bac) for each N=10...
I guess "we" should calculate a SNR for each netSig...
I guess "we" should calculate a ratio of avg(netSig_day2) / avg(netSig_day3)
Or, I'm thinking aboot how Carol was showing the CAS stability,
maybe we should show each of the 20x netSig's divided by the avg(netSig,N=20) ?
Or does she show netSig(#N) / netSig(#1) ?
I did not see any Voltage dropouts for the humidity Vin today.
I did look at the Humid sensor doc and I think the 33%RH output is correct -
using the correction equation they show in the doc.
I'll talk to Mark tomorrow to see if I can do a Nitrogen-purge to get %RH down.
Anyway, the 30x .fits data are on your ftp kine, plus one aux*.txt and one log .jpg.
Thank you, MF
Hi Steph,
I just scanned the 5x Oriel pen lamps tonight = day04.
The exposure time was 0.05 for HgA & Ne which is too fast
for a 35 ms shutter delay, but I didn't want to spend lots of time
diddling the setup to move those lamps outside the sphere.
The Ne scan was definitely saturated. That might be interesting...
I also had to run the HgA & Ne lamps at Voltage lower than normal.
The other 3x lamps were more cooperative: Ar, Kr, Xe.
Out of these we should get some stable reference lines,
and maybe a decent wave cal.
See you, MF
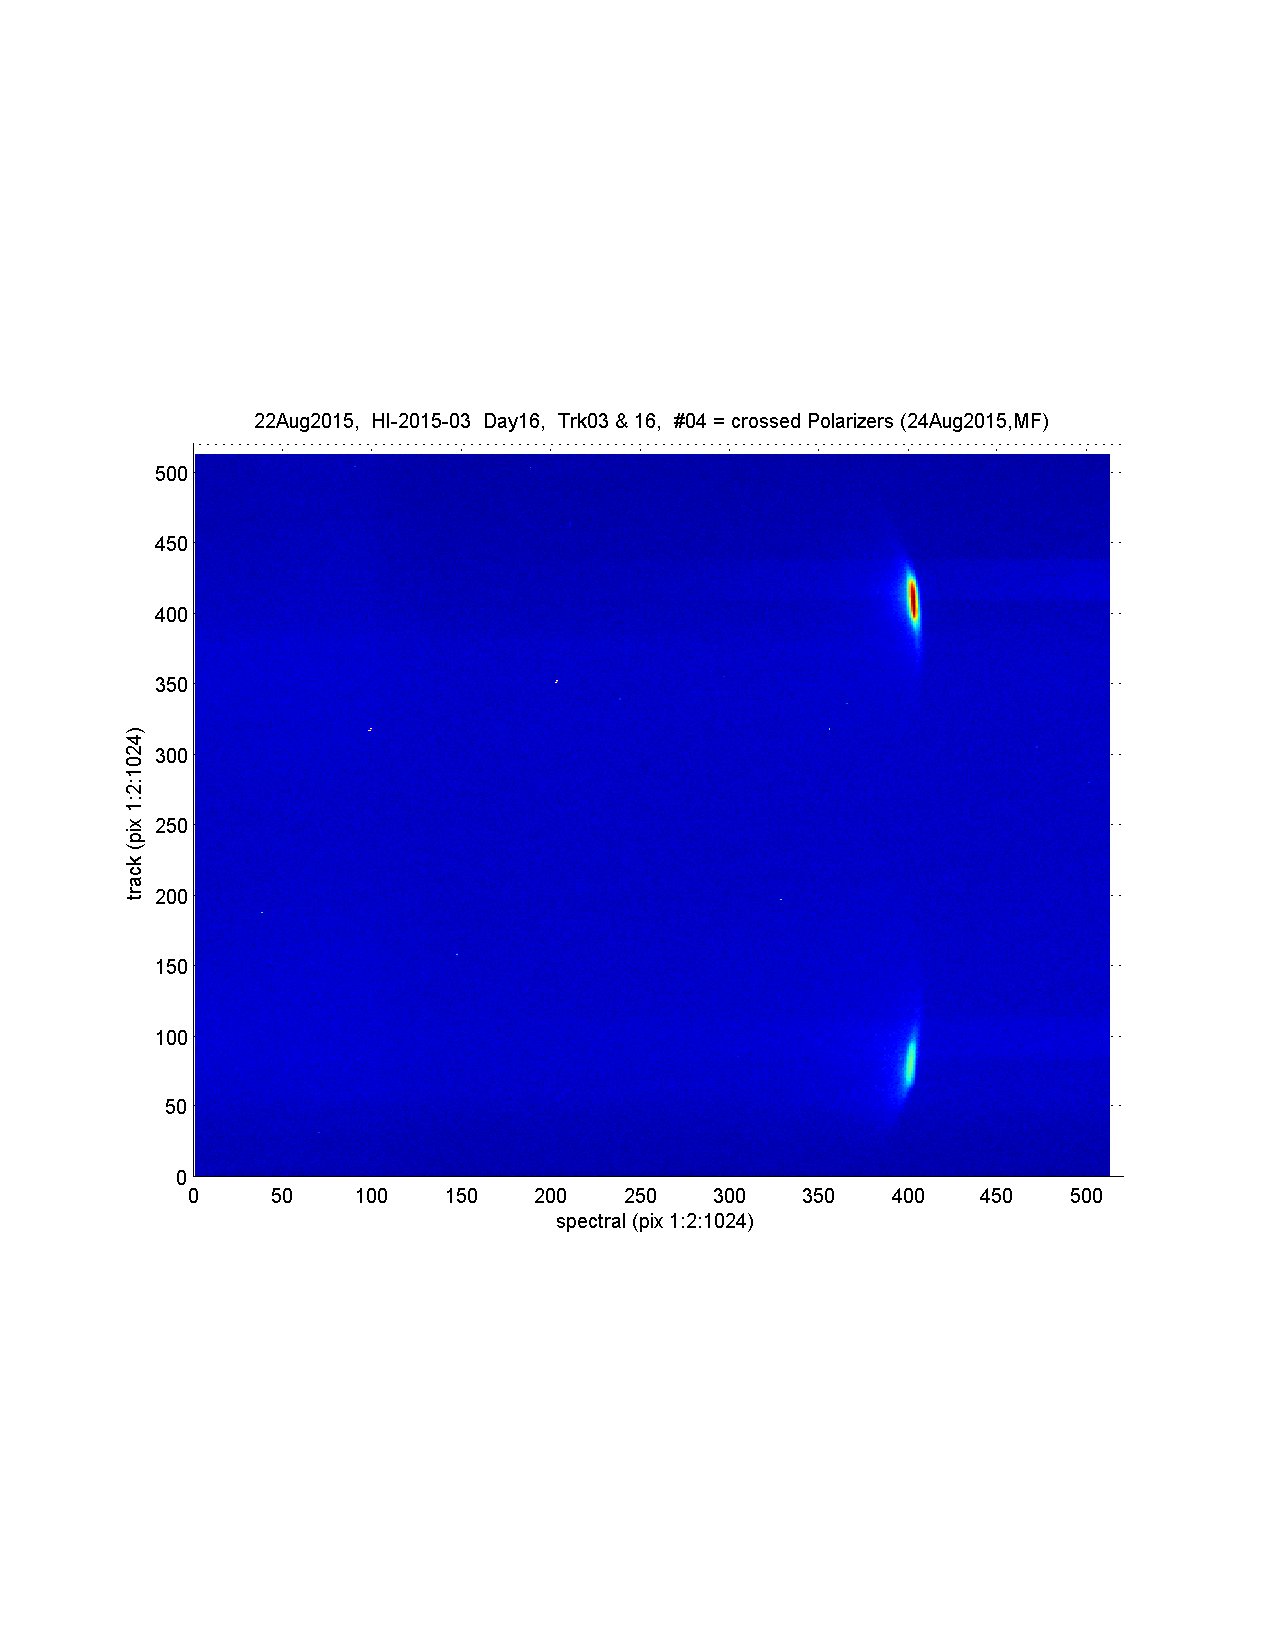
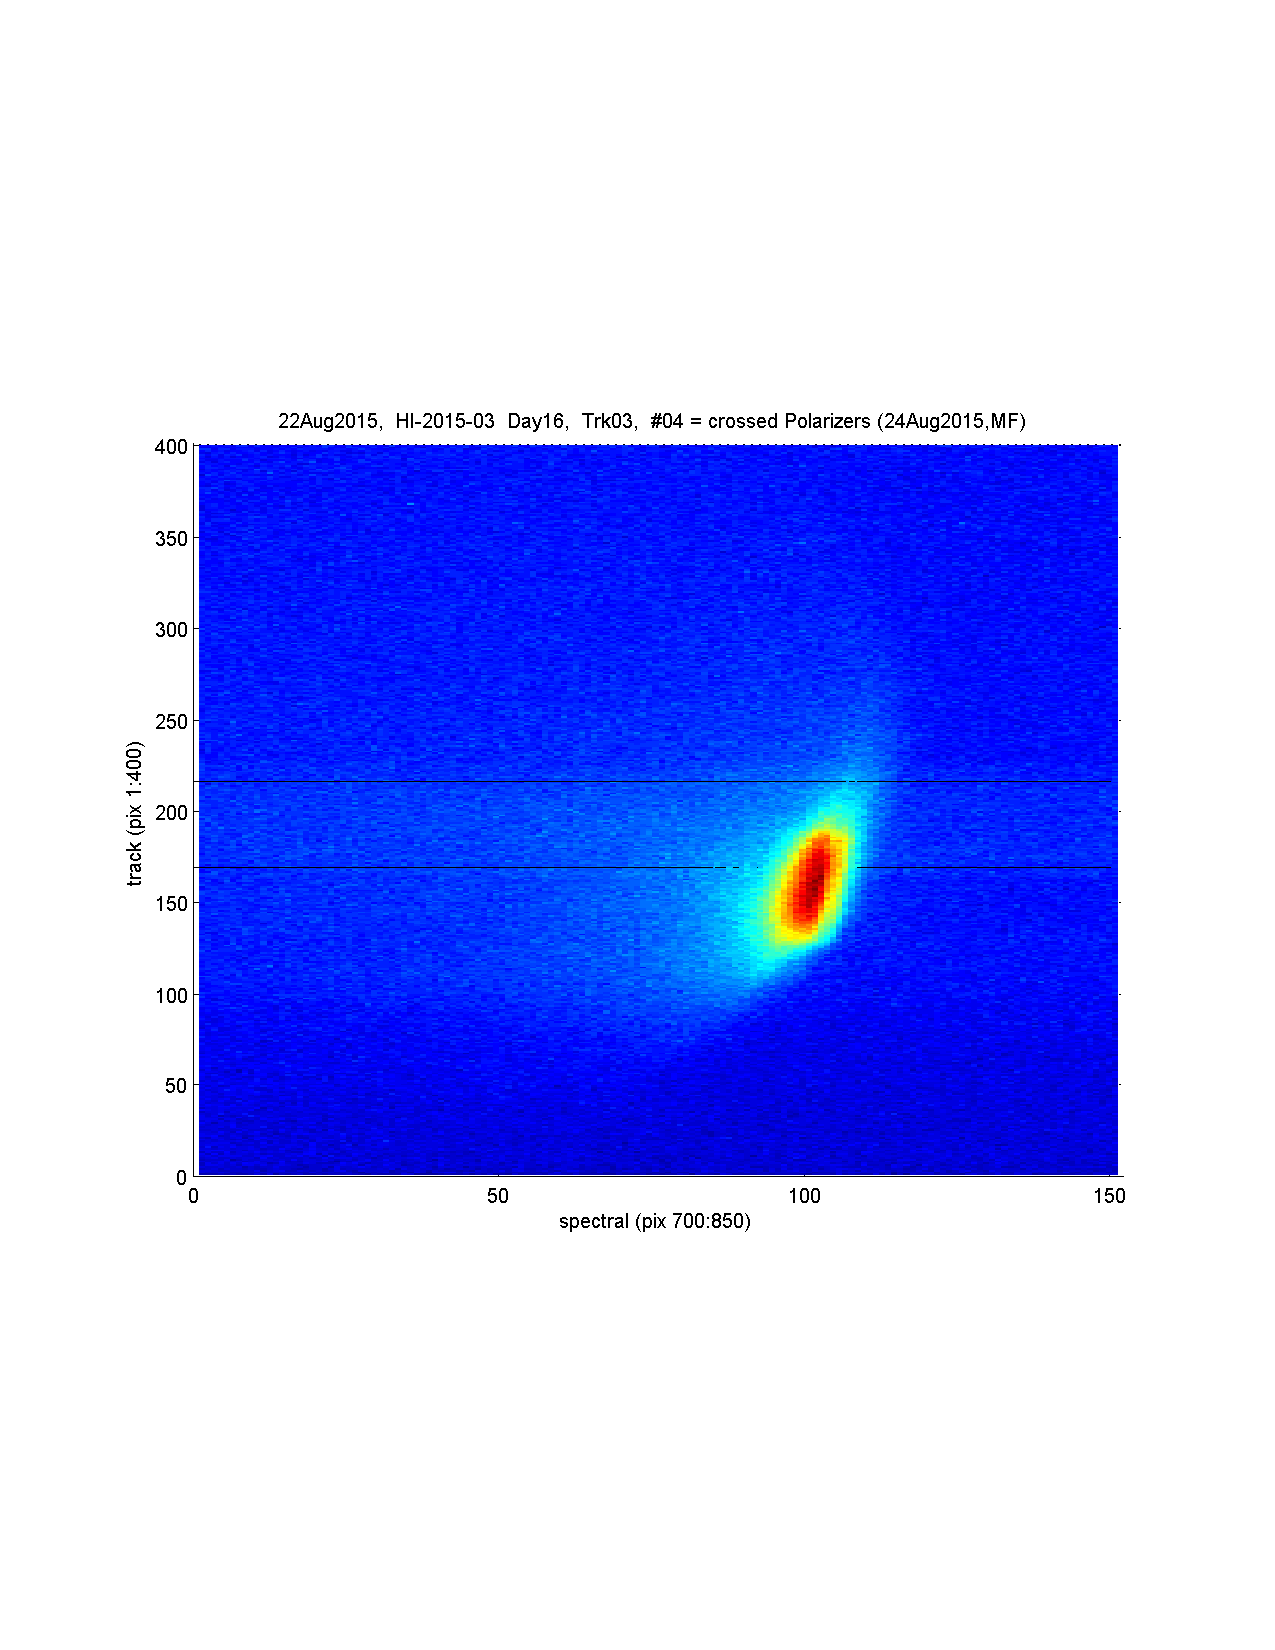
Hi Steph,
I got the OL455 back in front of BS01cfg03 again today.
I used only FO #8, at the centre of the jig - there are some new photos,
and first scanned the OL455 with 2x crossed Melles Griot polarizers
between Trk08 and the sphere. This was to look for the Infrared Artifact,
which showed up during HI-2015-03 on day 16, scan #04 -
see my attached: day16ghost.png & day16ghost-trk3.png.
I ran the BS at 90 sec exposure time, and collected 1x each:
amb = shuttered sphere, sig, and bac.
Then I removed the polarizers and butted the jig up to the OL455
and scanned 5x sig & bac for your single-track request.
FO #8 was moved to the centre of the jig and there was an
extra aperture on the OL455 exit port (to match the polarizers),
and the PD monitor was a little different than day 02 & 03,
but it should be interesting to compare day 02, 03 & 05 for Trk 08...
There is one log sheet, one aux file, and some new photos.
Tomorrow I plan to get a Sun / Fronhoffer scan.
Aloha, MF
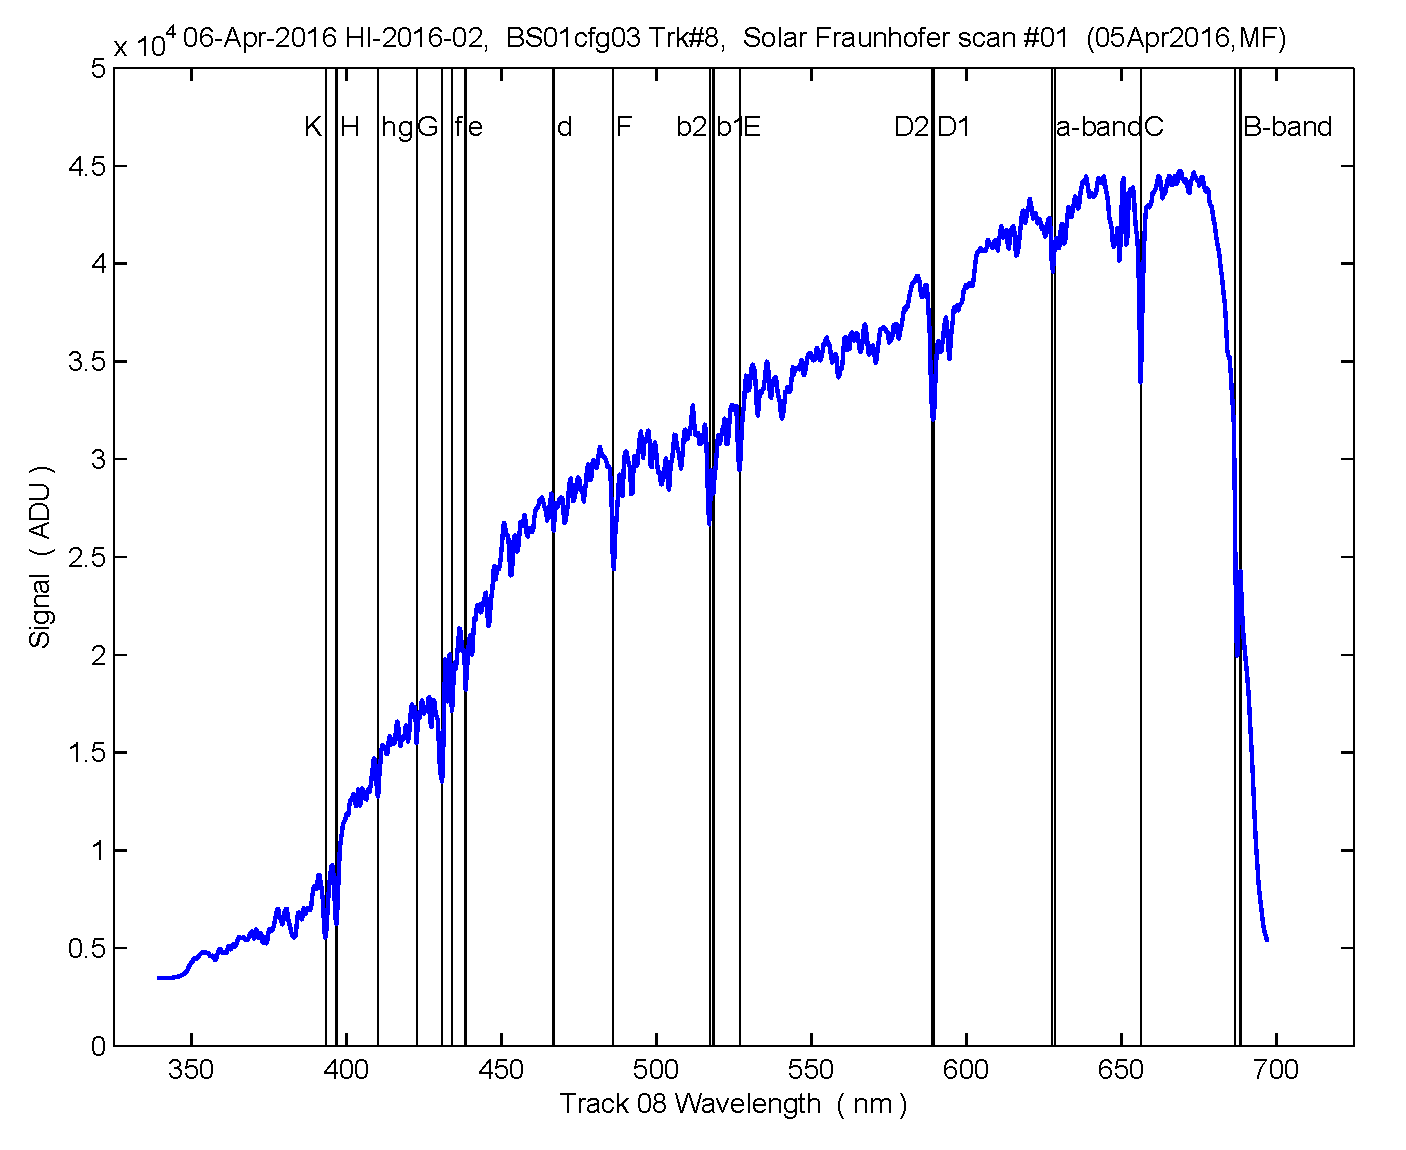
Hello Stephanie,
Day06 data are heading to the FTP for you now.
Only 5x sig,bac pairs, from Trk08, via a long MOBY259 Es FO#700 pointed
at a gray reflectance plaque + the Sun. I took some photos of the setup.
It turns out the cloud cover helped today - when it was not raining.
A clear sky + full Sun would have been too bright.
I used a gray plaque because pointing the bare fiber at the clouds was too bright,
and pointing a bare fiber at a white plaque under said clouds was also too bright.
I had a look at the data because I got nervous the fluorescent lighting
in the van might have leaked through the uncovered FO-to-FO coupling, but
file #1 looked ok, so I got a little carried away adding Fraunhofer lines to my plot <attached: day06_Fraunhofer.png> - after using your T8 track boundaries,
and your T8 wavecal. I think you nailed the wavecal!
I had to rename photos from yesterday in the dir: /ftp1/Mike/HI-2016-02/photos
from 2016-04-04*.jpg, to 2016-04-05*.jpg
because they were really 05Apr GMT (not 04Apr HST),
hope that does not cause you too much headache.
Perhaps it is time to ship the BS1 to Miami and move on the the BS2 ?
MF
Hello Stephanie,
Ground Hog Day 07 = same as day 06, except I turned off the van lights on day 07,
and I scanned an amb at start & end, and there was bright Sun today, so the
exposure time was FAST @ 0.07 sec.
Good Luck, MF
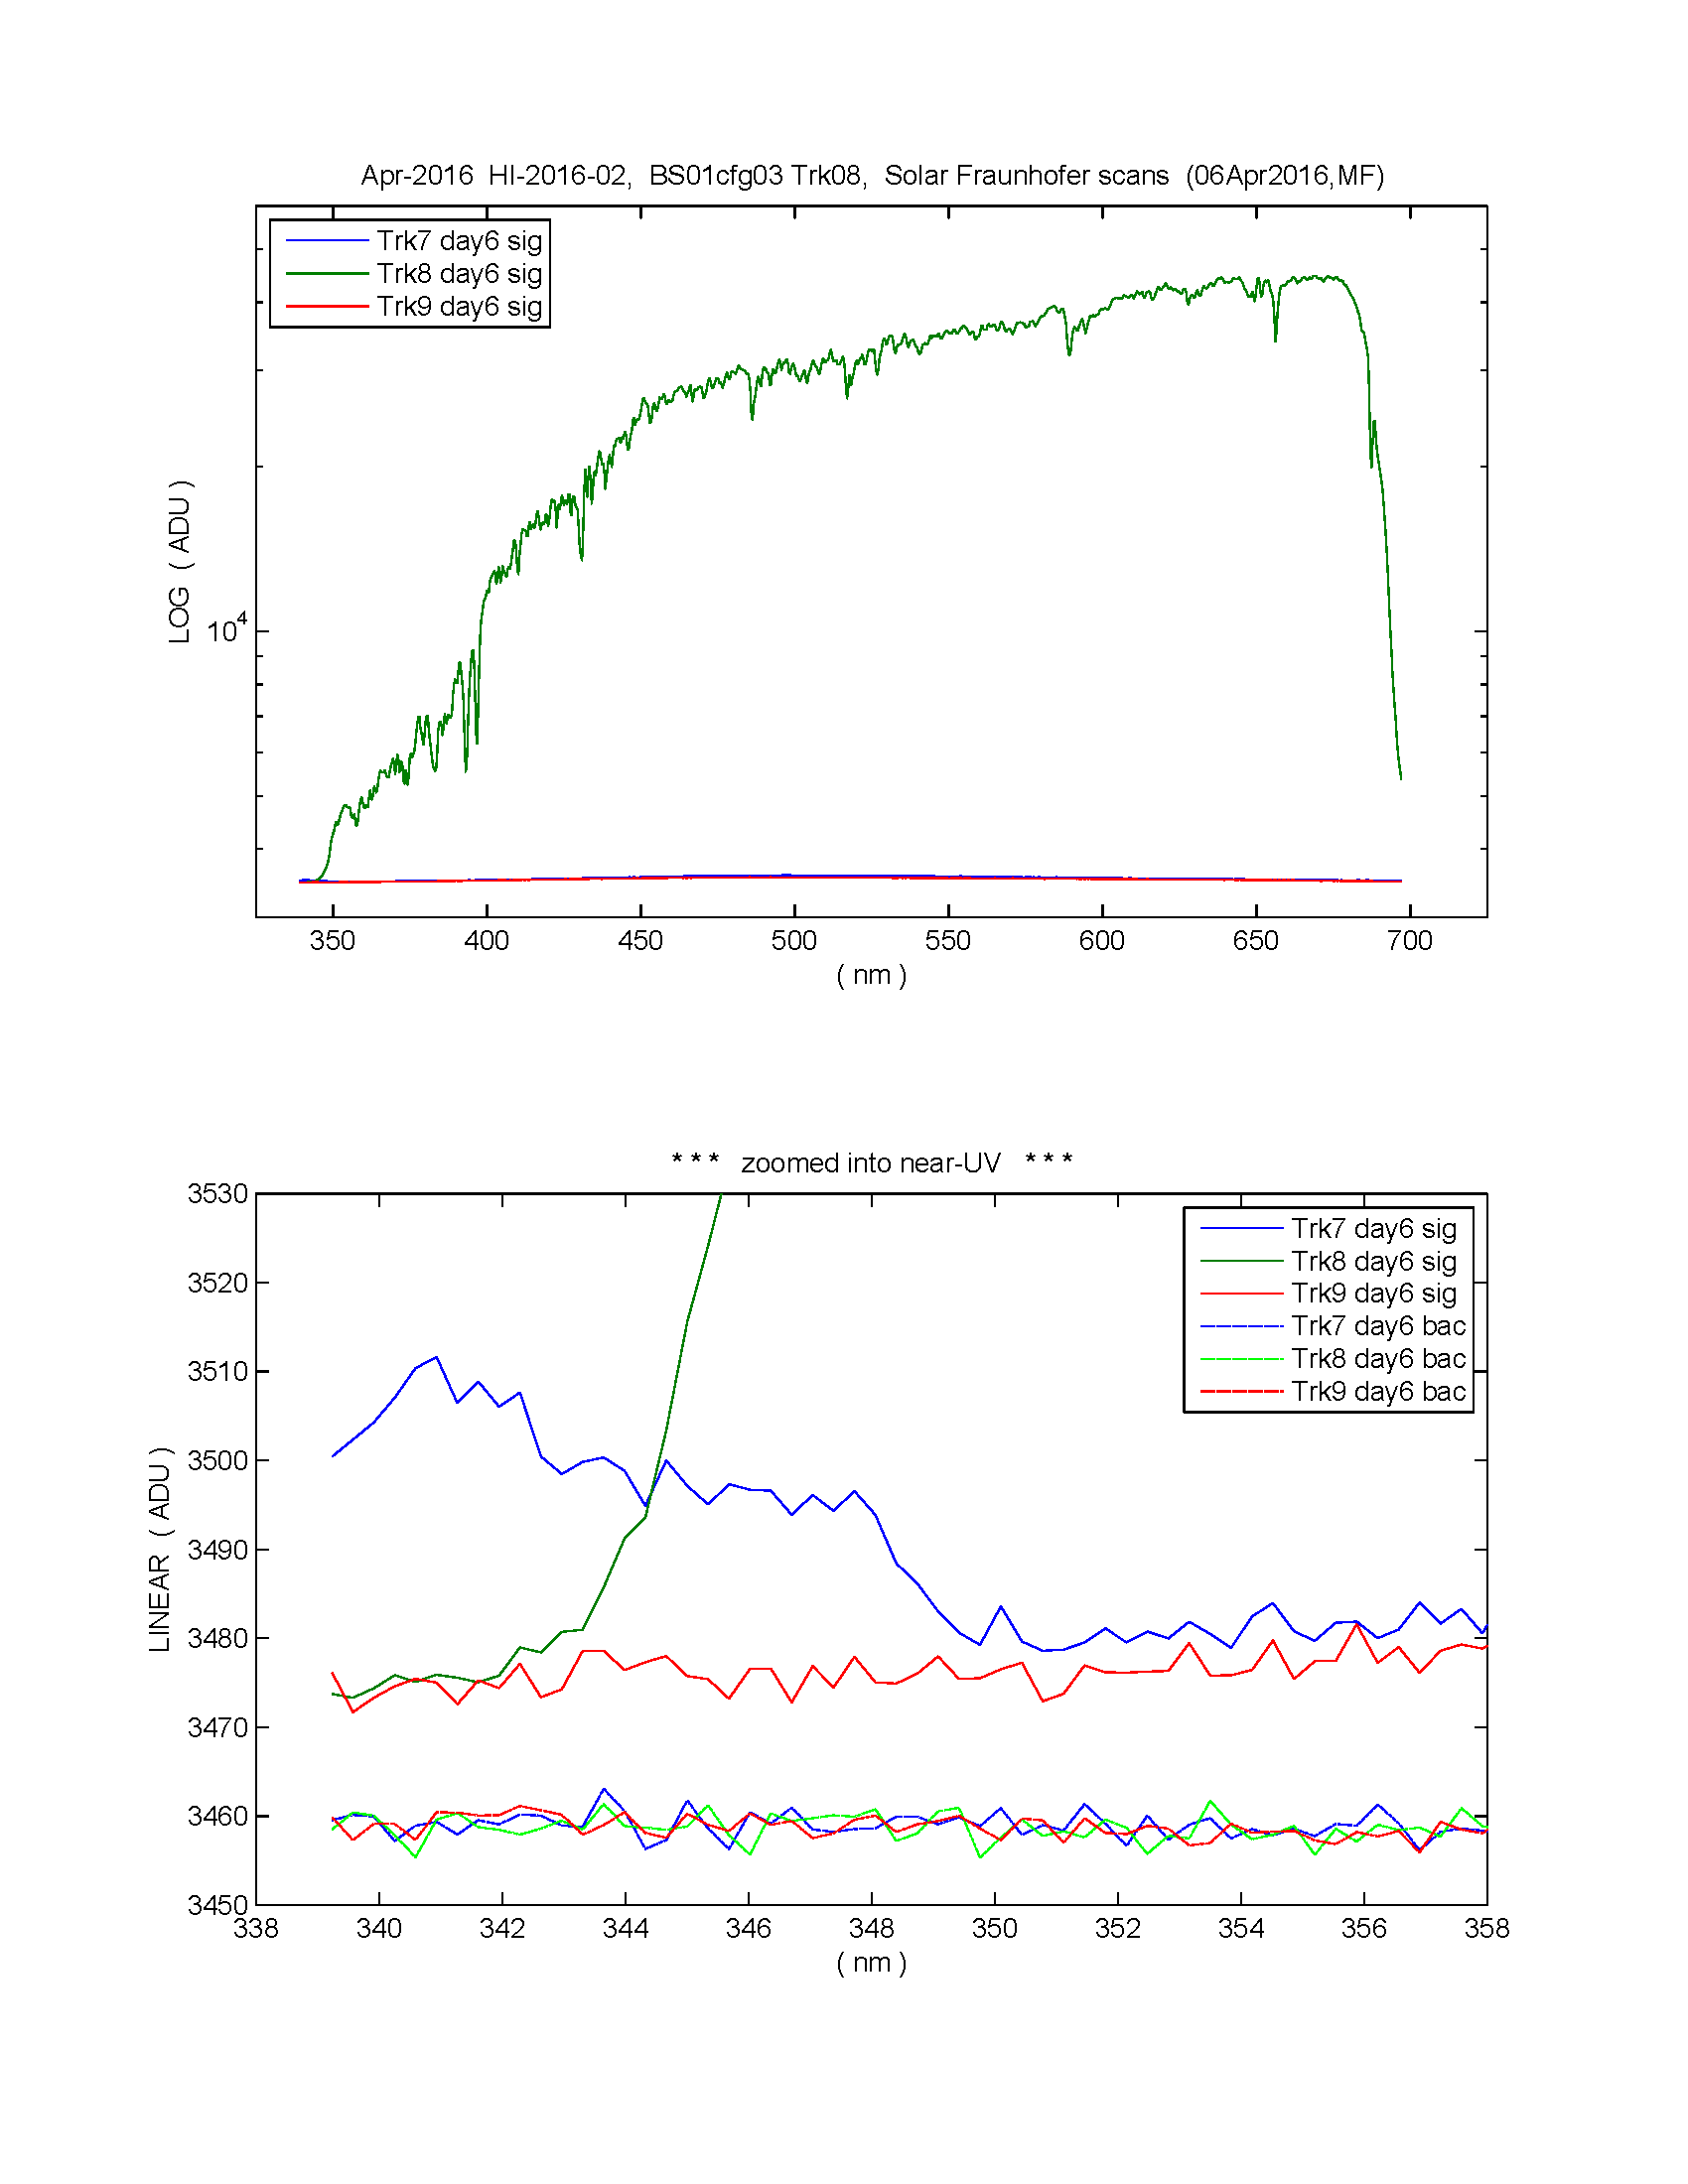
Hi Steph
I don't see any diff between day6 & day7 either (nor any issue with day7 amb), so I was looking more closely at day6, and it looks to me like the
near-UV turn-up on Trk7 has more ADU than the lighted Trk8 near-UV,
i.e. see bottom panel on attached plot,
which is linear scale, and I also added the bac scans for reference
<attached: day06_Fraunhofer_2.pdf & day06_Fraunhofer_2.png>
Could you see if I am doing this correctly?
If this is correct, then perhaps the T7 near-UV signal is coming from
somewhere other than just cross-track coupling with Trk8?
Thanks, MF