MOBY2 Sept 2012 FISH shadowing data listing - OAHU-13
Data Table Listing
Doc#
| Purpose
| Link to Docs
| Description
| Date Updated |
|---|---|---|---|---|
1.01 |
Channels |
PDF from Carol on Channel assignments |
Sept 20, 2012 |
|
1.02 |
Write-up |
Carol's start on a Experiment write up |
Sept 20, 2012 |
|
1.03 |
Trip Report |
Carol Trip report |
Sept 20, 2012 |
|
1.04 |
Fork Layout |
Carols Fork measurements and layout |
Sept 27, 2012 |
|
1.05 |
meeting |
Sept 4th meeting topics (updated) |
Sept 27, 2012 |
|
1.06 |
Res Logs |
Mike's Log sheets from FISH Data collection |
Sept 27, 2012 |
|
1.07 |
Boat Logs |
Terry boat logs with fork position and wind and wave conditions |
Oct 8, 2012 |
|
1.08 |
CTD/Hyp logs |
Mike O and Darryls data log sheets |
Oct 16 2012 |
|
1.09 |
OL455 cal |
Carol cal report of her OL455 source |
Nov 6, 2012 |
|
1.10 |
Log data |
Excel file with the boat form and MikeO logs entered |
Nov 6, 2012 |
|
1.11 |
Gain |
Certificate of Performance (CoP)
from Princeton Instruments (PI) = BLUE SPEC |
Nov 19, 2012 |
|
1.12 |
Gain |
Certificate of Performance (CoP)
from Princeton Instruments (PI) = RED SPEC |
Nov 19, 2012 |
|
1.13 |
FOV |
Documentation of the 4 FOV experiments completed |
Jan 8, 2013 |
|
1.14 |
OL455 |
OL455 Radiances (Jan 14 2013) |
Jan 17, 2013 |
|
1.15 |
OL455 |
Letter to Mike Ondrusek |
Jan 17, 2013 |
|
1.16 |
OL455 |
Validation of Ocean Color Up-welling Radiometer |
Jan 17, 2013 |
|
1.17 |
OL455 |
Calibration of NIST’s OL455 using the VXR for support of the FISH |
Jan 17, 2013 |
|
1.18 |
Trip report |
Mark 6 month NIST report which includes the shadowing experiment |
Apr 8, 2013 |
|
1.19 |
Resonon cfg |
Resonon config details for the red and blue spec |
Apr 26, 2013 |
|
1.20 |
CCD details |
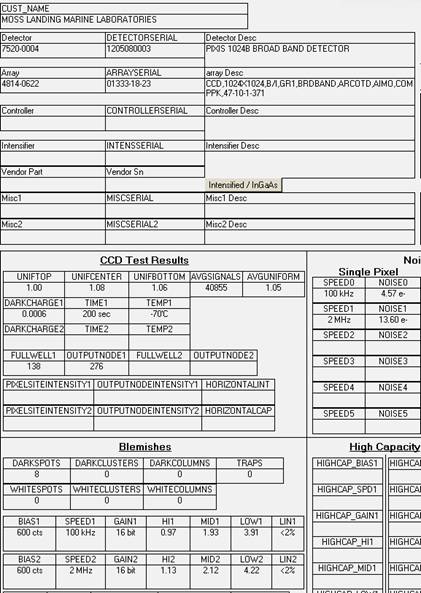
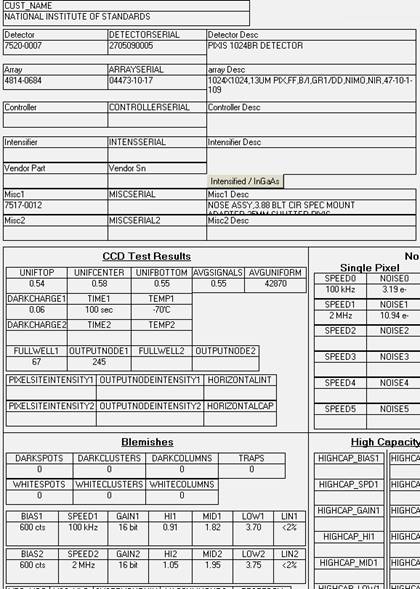
High Performance CCD red and blue spec |
Apr 26, 2013 |
|
1.21 |
dark test |
Data showing the bias tempco for Red and Blue CCD cameras (Mark) |
May 1, 2013 |
|
1.22 |
FISH problems |
Short overview of the FISH problems see during trip |
May 16, 2013 |
FISH Data Listing (cals, LED, inwater)
Exp#
| Experiment | Directory or Graphs | Description | Problems | Date Updated |
|---|---|---|---|---|---|
| 1.01 | LED stablity | LED stability | All the LED data stability starting on day 5 to present | Nov 14, 2012 | |
| 1.02 | Track stability | Track Stability | Track stability for all data to present | Sept 17, 2012 | |
| 1.03 | All darks | All darks verses int time | Plots of all the darks or Track 7 verses intergration time (Gain and ADC rate in legend) | Nov 14, 2012 | |
| 1.04 | Comp rsp | Compare system responses | Compare the system responses from three different cals. | Sept 21, 2012 | |
| 1.05 | LED TS | LED time series plots | All LED data collected and plotted | Nov 14, 2012 | |
| 1.06 | Rel rsp | OL455 responses relative to Track 9 | All OL455 rsp data relative to Track 9 (bare fiber) collected in Hawaii | Nov 9, 2012 | |
| 1.07 | Chose rsp | Chose an system response | Compare the system responses from three different cals. | Sept 21, 2012 | |
| 1.08 | LED by Exp | LED stability data grouped by experiment | ThorLab (Trck 14) LED data grouped by experiment | Apr 11, 2013 | |
| 1.09 | All darks -BSG | Looking a changes in before/after darks - BSG only (ADU/pix/sec) | Plot showing the variation in the darks collected before and after the lites. | Apr 18, 2013 | |
| 1.10 | All darks -RSG | Looking a changes in before/after darks - RSG only (ADU/pix/sec) | Plot showing the variation in the darks collected before and after the lites. | Apr 18, 2013 | |
| 1.11 | All darks -BSG | Looking a changes in before/after darks - BSG only (ADU/pix) | Plot showing the variation in the darks collected before and after the lites. | Apr 18, 2013 | |
| 1.12 | All darks -RSG | Looking a changes in before/after darks - RSG only (ADU/pix) | Plot showing the variation in the darks collected before and after the lites. | Apr 18, 2013 | |
| 1.13 | Keystoning | Keystoning vs model with smile complications | Keystoning and smile | Jun 6, 2013 | |
| 1.14 | Smile | Using the wavecal Pen Lamps to look at CCD smile | Looking a CCD Smile | Jun 13, 2013 | |
| 2.01 | Daily in-water | 13 Sept - Day 2 - cloudy | Daily file plots of in-water data and Es with Ratios - mean of 5 | Sept 18, 2012 | |
| 2.02 | Daily in-water | 14 Sept - Day 3 - cloudy | Daily file plots of in-water data and Es with Ratios | Sept 18, 2012 | |
| 2.03 | Daily in-water | 15 Sept - Day 4 - sunny | Daily file plots of in-water data and Es with Ratios | Sept 18, 2012 | |
| 2.04 | Daily in-water | 15 Sept - Day 4B - sunny | Daily file plots of in-water data and Es with Ratios | Sept 18, 2012 | |
| 2.05 | Daily in-water | 16 Sept - Day 5 - sunny | Daily file plots of in-water data and Es with Ratios | Sept 18, 2012 | |
| 2.06 | Daily in-water | 16 Sept -Day 5B - sunny | Daily file plots of in-water data and Es with Ratios | Sept 18, 2012 | |
| 2.07 | Daily in-water | 17 Sept - Day 6 - cloudy | Daily file plots of in-water data and Es with Ratios | Sept 18, 2012 | |
| 2.08 | Daily in-water | 17 Sept - Day 6B - cloudy | Daily file plots of in-water data and Es with Ratios | Sept 18, 2012 | |
| 2.09 | Daily in-water | 18 Sept - Day 7 - sunny | Daily file plots of in-water data and Es with Ratios | Sept 18, 2012 | |
| 2.10 | Daily in-water | 18 Sept - Day 7B - sunny | Daily file plots of in-water data and Es with Ratios | Sept 18, 2012 | |
| 2.12 | Daily in-water | 14 Sept - Day 3 - cloudy | Daily file plots of in-water data and Es with Ratios - indiv images | Nov 30, 2012 | |
| 2.13 | Daily in-water | 15 Sept - Day 4 - sunny | Daily file plots of in-water data and Es with Ratios | Nov 30, 2012 | |
| 2.14 | Daily in-water | 15 Sept - Day 4B - sunny | Daily file plots of in-water data and Es with Ratios | Nov 30, 2012 | |
| 2.15 | Daily in-water | 16 Sept - Day 5 - sunny | Daily file plots of in-water data and Es with Ratios - | Nov 30, 2012 | |
| 2.16 | Daily in-water | 16 Sept - Day 5B - sunny | Daily file plots of in-water data and Es with Ratios | Nov 30, 2012 | |
| 2.17 | Daily in-water | 17 Sept - Day 6 - cloudy | Daily file plots of in-water data and Es with Ratios - | Nov 30, 2012 | |
| 2.18 | Daily in-water | 17 Sept - Day 6B - cloudy | Daily file plots of in-water data and Es with Ratios | Nov 30, 2012 | |
| 2.19 | Daily in-water | 18 Sept - Day 7 - sunny | Daily file plots of in-water data and Es with Ratios - | Nov 30, 2012 | |
| 2.20 | Daily in-water | 18 Sept - Day 7B - sunny | Daily file plots of in-water data and Es with Ratios | Nov 30, 2012 | |
| 3.01 | Hyper Es | Day 5 Es data | HyperPro Es (direct and diffuse) and compared to FISH Es | Dec 7, 2012 | |
| 3.02 | Hyper Es | All HyperPro Es data (to date) | HyperPro Es time series | Oct 16, 2012 | |
| 3.03 | Hyper Es | All HyperPro Lu profile data (to date) | HyperPro Lu Profile data | Oct 26, 2012 | |
| 3.04 | Hyper Es | All HyperPro Es data with occulted ratios | HyperPro Es Profile data (occulted with ratios) | Dec 7, 2012 | |
| 3.05 | Hyper Es | All HyperPro Es data with occulted ratios - EAST COAST | HyperPro Es Profile data (occulted with ratios) - EAST COAST | Jan 28, 2013 | |
| 3.06 | Hyper Es | HyperPro Es data and model | HyperPro Es data and model to look a zenith angle effects | Feb 27, 2013 | |
| 3.07 | FISH Occult | Fish Dec 6occulted data | FISH occulted on | Mar 20, 2013 | |
| 3.08 | Mike comp | Mike comparison graphs | Mike comparison graphs of 4 instrument occulting | Mar 20, 2013 | |
| 3.09 | Satlantic | HyperPro occulted Es question | Glenn Davidson's documenation of the occulting questions | Mar 20, 2013 | |
Exp#
| Experiment | Directory or Graphs | Description | Problems | Date Updated |
| 4.01 | Day 7 data | All Day 7 data (FISH, CTD, Dennis's edits, HyperPro) | Only Day 7 data for Jim | Mar 19, 2013 | |
Exp#
| Experiment | Directory or Graphs | Description | Date Updated | |
FISH Data - Stability testing in Cal Hut (BSG and RSG not simultaneous and romack only, no beam spliter or long fibers) |
|||||
| 10 | OL420 #1 | 20120907_OL420 | OL420 data (Track 3,5,7,9,11 and 13) | Sept 17, 2012 | |
10.01 |
trck def |
|
html and graphs | Sept 18, 2012 | |
10.02 |
trck def |
|
html and graphs | Sept 18, 2012 | |
| 11 | OL420 #2 | 20120908_OL420 | OL420 and LED data (Track 3,5,7,9,11 and 13) | readout errors | Sept 17, 2012 |
11.01 |
comp days |
|
html and graphs | Sept 18, 2012 | |
11.02 |
comp days |
|
html and graphs | Sept 18, 2012 | |
11.03 |
comp days |
|
html and graphs | Sept 18, 2012 | |
11.04 |
readout err |
|
html and graphs | Sept 18, 2012 | |
11.05 |
comp |
|
html and graphs | Oct 9, 2012 | |
FISH Data - Long fibers, beam splitters and Track 14 led now on (in cal hut) |
|||||
| 12 | OL420 #3 | 20120910_OL420 | OL420 data (Track 3,5,7,9,11 and 13) | Sept 17, 2012 | |
12.01 |
trck check |
|
html and graphs | Sept 18, 2012 | |
12.02 |
trck check |
|
html and graphs | Sept 18, 2012 | |
12.03 |
darks |
|
html and graphs | Oct 9, 2012 | |
12.04 |
darks |
|
html and graphs | Oct 9, 2012 | |
12.05 |
darks/tmp |
|
html and graphs | Oct 9, 2012 | |
12.06 |
comp |
|
html and graphs | Oct 9, 2012 | |
12.07 |
comp |
|
html and graphs | Oct 9, 2012 | |
| 13 | LED | 20120909_LED | Cypress and Thorlabs T14 LED data (Track 3,5,7,9,11 and 13) | Sept 17, 2012 | |
13.01 |
comp |
|
html and graphs | Oct 9, 2012 | |
| 14 | Wavecal | 20120910_Wavecal | Wave cal and laser data, one Es scan | Sept 17, 2012 | |
14.01 |
comp |
|
html and graphs | Oct 9, 2012 | |
14.02 |
comp |
|
html and graphs | Oct 9, 2012 | |
14.03 |
smile |
|
html and graphs | Jun 13, 2013 | |
FISH fibers disconnected, instrument on the boat. Day 4 rsp track 9 11 and 13 changed by 10%. |
|||||
| 15 | In-water | 20120912_Day01 | In-water test with the fork, no disks | No RSG data | Sept 17, 2012 |
| 16 | Plaques | 20120913_Day02_Plaque | Fibers on deck grey plaque and tiles | darks have problem, too low | Sept 17, 2012 |
16.01 |
comp |
|
html and graphs | Oct 12, 2012 | |
16.02 |
comp |
|
html and graphs | Oct 12, 2012 | |
16.03 |
darks |
|
html and graphs | Oct 12, 2012 | |
| 17 | OL455 Es | 20120913_Day02_OL455 | NIST OL455 lamp and wavelength cal | Sept 17, 2012 | |
| 18 | In-water | 20120913_Day02 | In-water test with the fork, w/ disks (7, 16 24 and 32 cm) | Sept 17, 2012 | |
| 19 | Dark test | 20120913_Day02_dark | Dark tests (Gain and ADC Rate) | Sept 17, 2012 | |
19.01 |
darks |
|
html and graphs | Oct 12, 2012 | |
| 20 | Dark test | 20120913_Day02_winview | WinView used to check the darks | Sept 17, 2012 | |
| 21 | In-water | 20120914_Day03 | In-water test with the fork, with disks (7, 16 24 and 32 cm) | Sept 17, 2012 | |
Started taking some data with other Gain factors and ADC Rates |
|||||
| 22 | FEL Es | 20120915_Day03_FEL | Es calibration (MLML FEL) and Es wavelength cal | Sept 17, 2012 | |
22.01 |
wavecal |
|
html and graphs | Oct 12, 2012 | |
22.02 |
wavecal |
|
html and graphs | Oct 12, 2012 | |
| 23 | In-water | 20120915_Day04 | In-water data with the fork, with disks (7, 16, 24, and 32 cm) | possible problem with Track 13 | Sept 17, 2012 |
| 24 | In-water | 20120915_Day04B | In-water data with the fork, with disks (7, 16, 24 and 50 cm) | possible problem with Track 13 | Sept 17, 2012 |
| 25 | Dark test | 20120915_Day04_darktest | Dark tests (Gain and ADC Rate) | Sept 17, 2012 | |
25.01 |
darks |
|
html and graphs | Oct 12, 2012 | |
25.02 |
darks |
|
html and graphs | Oct 12, 2012 | |
| 26 | In-water | 20120916_Day05 | In-water data with the fork, with disks (7, 16, 24, and 50 cm) | Track 13 problem gettin worse | Sept 17, 2012 |
| 27 | In-water | 20120916_Day05B | In-water data with the fork, with disks (7, 16, 24 and 32 cm) | Track 13 problem gettin worse | Sept 17, 2012 |
| 28 | Dark test | 20120916_Day05_darktest | Dark test of gain and ADC Rate and light leaks | Sept 17, 2012 | |
28.01 |
light leak |
|
html and graphs | Oct 17, 2012 | |
| 29 | LED | 20120917_Day05_LED | LED in each track to check Track changes including the Track 13 change | Sept 17, 2012 | |
| 30 | In-water | 20120917_Day06 | In-water data with the fork, with disks (7, 16, 24, and 32 cm) | Track 13 problem improved | Sept 17, 2012 |
| 31 | In-water | 20120917_Day06B | In-water data with the fork, with disks (7, 16, 24 and 50 cm) | Track 13 problem improved | Sept 17, 2012 |
| 32 | LED | 20120918_Day06_LED | LED in each track to check Track changes including the Track 13 change | Sept 17, 2012 | |
32.01 |
trck check |
|
html and graphs | Sept 18, 2012 | |
| 33 | In-water | 20120918_Day07 | In-water data with the fork, with disks (7, 16, 24, and 50 cm) | Sept 17, 2012 | |
| 34 | In-water | 20120918_Day07B | In-water data with the fork, with disks (7, 16, 24 and 32 cm) | Sept 18, 2012 | |
| 35 | In-water | 20120918_Day07C | In-water data with the fork, with disks (7, 16, 24, and 50 cm) - BSG only | Sept 18, 2012 | |
| 36 | In-water | 20120918_Day07D | In-water data with the fork, with disks (7, 16, 24, and 32 cm) - BSG only | Sept 18, 2012 | |
| 37 | LED | 20120918_Day07_LED | LED in each track to check Track changes including the Track 13 change | Track 13 looks saturated??? | Sept 18, 2012 |
37.01 |
trck check |
|
html and graphs | Sept 18, 2012 | |
| 38 | OL455 | 20120918_Day07_OL455 | NIST OL455 lamp and wavelength cal | Zeros in darks again | Sept 19, 2012 |
38.01 |
dark prblm |
|
html and graphs | Sept 19, 2012 | |
38.02 |
blooming?? |
|
html and graphs | Nov 7, 2012 | |
| 39 | FEL | 20120921_FEL | MLML FEL lamp Es cal | Sept 21, 2012 | |
39.01 |
dark prblm |
|
html and graphs | Sept 19, 2012 | |
| 40 | OL455 | 20121109_OL455 | NIST OL455 lamp | Nov 09, 2012 | |
| 41 | OL455 | 20121114_OL455 | NIST OL455 lamp | Nov 09, 2012 | |
| 42 | OL455 | 20121115_OL455 | NIST OL455 lamp | Nov 15, 2012 | |
42.01 |
blooming |
|
html and graphs | Sept 19, 2012 | |
| 43 | OL420 | 20121116_OL420 | NIST OL420 lamp | Nov 20, 2012 | |
| 44 | OL420 | 20121120_OL420 | NIST OL420 lamp - repeat | Nov 20, 2012 | |
| 45 | Occult | 20121206_occult | FISH data with occulted Es | Dec 06, 2012 | |
45.01 |
es/model |
|
html and graphs | Dec 07, 2012 | |
| 46 | Linearity | 20121209_linearity | Mike's Linearity test with GS5000-14 Linearity Assembly | Dec 08, 2012 | |
46.01 |
linearity |
|
html and graphs | Jan 11, 2013 | |
46.02 |
linearity |
|
html and graphs | Jan 14, 2013 | |
46.03 |
linearity |
|
html and graphs | Jan 17, 2013 | |
46.04 |
linearity |
|
html and graphs | Jan 24, 2013 | |
46.05 |
linearity |
|
html and graphs | Jan 24, 2013 | |
46.06 |
linearity |
|
html and graphs | Jan 25, 2013 | |
| 47 | WV Bloom | 20121211_winview_blooming | Mike's trying to replicate the blooming problem with WinView | Dec 12, 2012 | |
47.01 |
blooming |
|
html and graphs | Dec 12, 2012 | |
| 48 | FOV | 20121212_FOV | Mike's FOV 1 and 2 experiment on | Dec 13, 2012 | |
48.01 |
FOV |
|
html and graphs | Jan 03, 2013 | |
| 49 | FOV | 20121214_FOV | Mike's FOV 3 and 4 experiment on | Dec 13, 2012 | |
49.01 |
FOV |
|
html and graphs | Jan 03, 2013 | |
| 50 | Linearity | 20130124_linearity | Mike's Linearity test with GS5000-14 Linearity Assembly - part 2 | Jan 28, 2013 | |
50.01 |
linearity |
|
html and graphs | Jan 29, 2013 | |
50.02 |
linearity |
|
html and graphs | Jan 29, 2013 | |
50.03 |
linearity |
|
html and graphs | Feb 07, 2013 | |
50.04 |
linearity |
|
html and graphs | Feb 11, 2013 | |
50.05 |
linearity |
|
html and graphs | Feb 19, 2013 | |
50.06 |
linearity |
|
html and graphs | Feb 21, 2013 | |
50.07 |
linearity |
|
html and graphs | Feb 21, 2013 | |
50.08 |
linearity |
|
html and graphs | Feb 26, 2013 | |